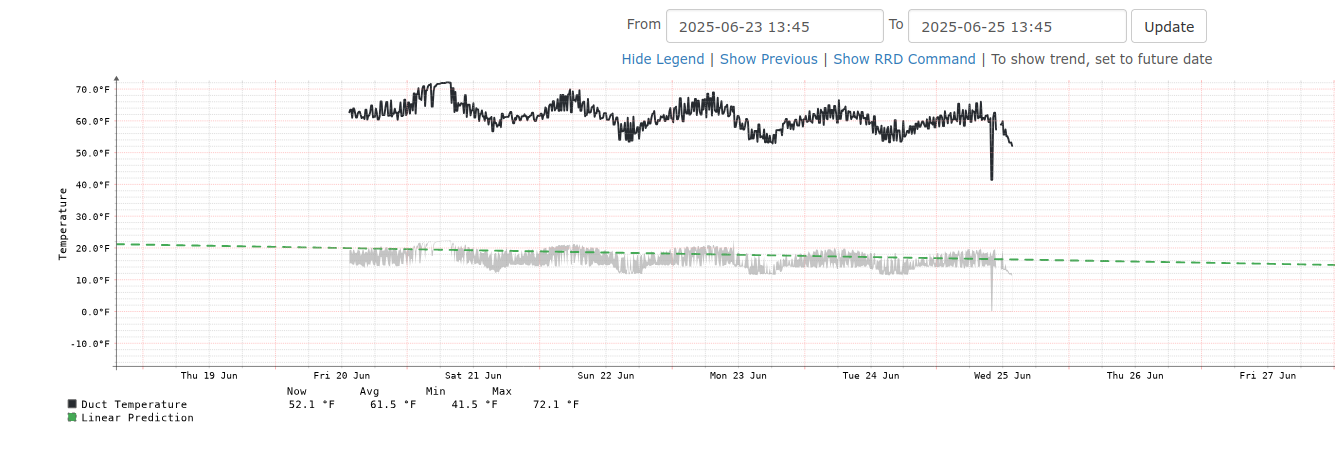
when the display temperature units are set to Fahrenheit,
temperature graphs still have some Celsius data points.
they’re hard to see unless you zoom way out, because they are present the auto-scaling is always off.
Any fixes welcome.
This topic was automatically closed 90 days after the last reply. New replies are no longer allowed.