I’ve noticed that LibreNMS’ virtual memory usage is constantly increasing, until it reaches near-100% usage. Here’s a screenshot showing virtual memory usage for the last month. The drops are after a LibreNMS reboot.
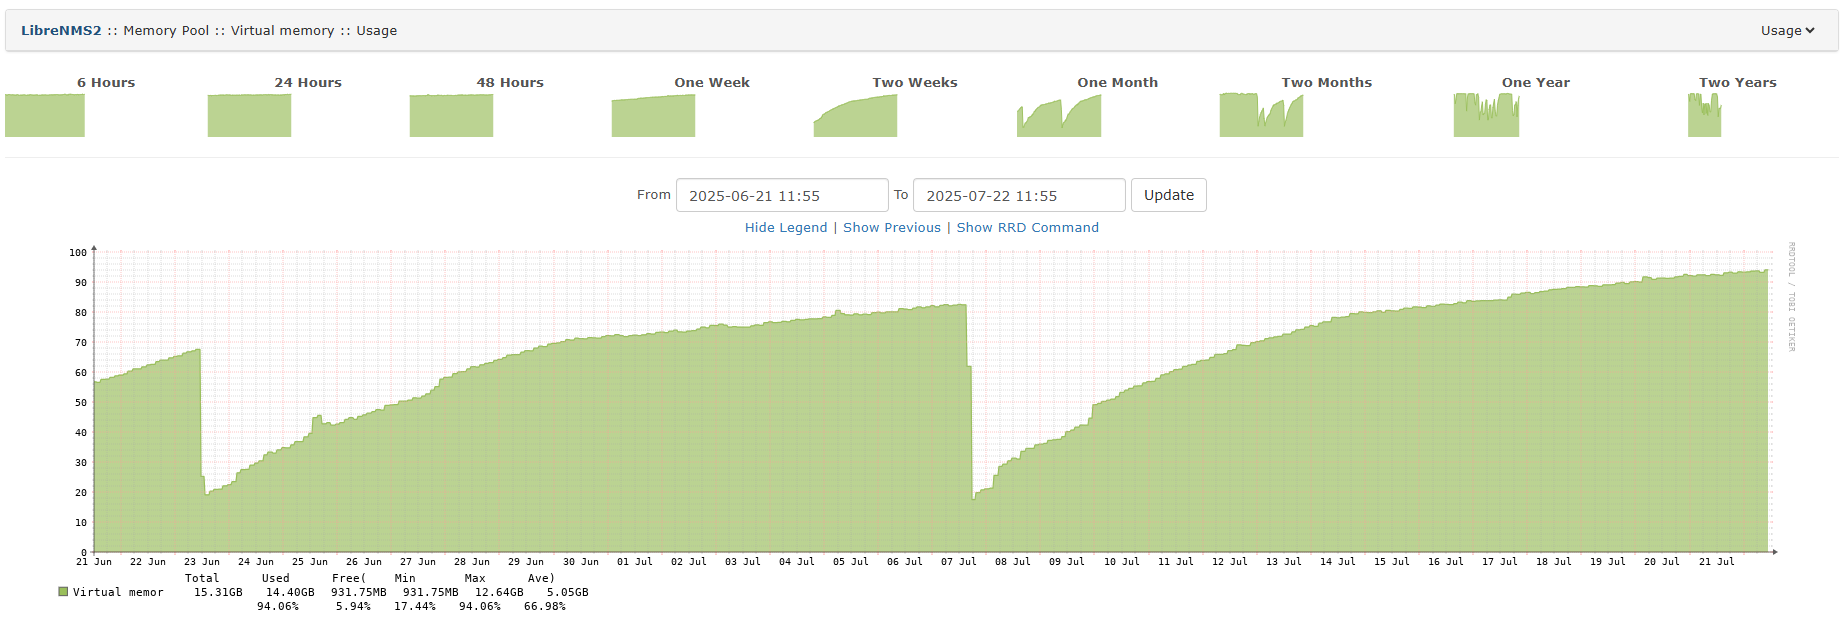
Is that normal behavior?
I’ve noticed that LibreNMS’ virtual memory usage is constantly increasing, until it reaches near-100% usage. Here’s a screenshot showing virtual memory usage for the last month. The drops are after a LibreNMS reboot.
Is that normal behavior?
You need to take a look at the usage from tools within your server (such as ps and top etc)
LibreNMS itself does not have long running processes, so it is unlikely this is LibreNMS.
Thank you for your reply. I just noticed something else:
I just rebooted the host running LibreNMS and ran ps aux --sort=-vsz. Here are the top 20 consumers, sorted by virtual memory consumption (VSZ):
USER         PID %CPU %MEM    VSZ   RSS TTY      STAT START   TIME COMMAND
root        1252  0.0  0.1 1917028 29388 ?       Sl   09:34   0:00 /snap/amazon-ssm-agent/11321/ssm-agent-worker
root         652  0.1  0.2 1847320 35416 ?       Ssl  09:34   0:01 /usr/lib/snapd/snapd
root         644  0.0  0.1 1832668 18984 ?       Ssl  09:34   0:00 /snap/amazon-ssm-agent/11321/amazon-ssm-agent
mysql        948  1.9  1.6 1690640 272696 ?      Ssl  09:34   0:14 /usr/sbin/mariadbd
librenms     860  0.8  0.0 1354200 11256 ?       Ssl  09:34   0:06 /usr/bin/rrdcached -B -F -R -w 1800 -z 1800 -t 4 -b /opt/librenms/rrd/ -j /var/lib/rrdcached/journal/ -G librenms -U librenms -p /run/rrdcached.pid -s librenms -l unix:/run/rrdcached.sock
librenms   16585  0.7  0.2 1305844 35564 ?       Sl   09:45   0:00 python3 /opt/librenms/poller-wrapper.py 16
root         699  0.0  0.0 472656 12676 ?        Ssl  09:34   0:00 /usr/libexec/udisks2/udisksd
root         833  0.0  0.0 398868 11812 ?        Ssl  09:34   0:00 /usr/sbin/ModemManager
polkitd      634  0.0  0.0 384672  8908 ?        Ssl  09:34   0:00 /usr/lib/polkit-1/polkitd --no-debug
root         224  0.0  0.1 290148 26132 ?        SLsl 09:34   0:00 /sbin/multipathd -d -s
librenms     772  0.1  0.3 243080 58520 ?        S    09:34   0:00 php-fpm: pool librenms
librenms     963  0.0  0.3 242956 55196 ?        S    09:34   0:00 php-fpm: pool librenms
librenms     771  0.0  0.3 242844 56196 ?        S    09:34   0:00 php-fpm: pool librenms
root         630  0.0  0.1 237200 30756 ?        Ss   09:34   0:00 php-fpm: master process (/etc/php/8.3/fpm/php-fpm.conf)
syslog       731  0.0  0.0 222816  4960 ?        Ssl  09:34   0:00 /usr/sbin/rsyslogd -n -iNONE
librenms   16610  0.4  0.4 150896 74388 ?        S    09:45   0:00 php /opt/librenms/lnms device:poll 44 -q
librenms   16630  0.4  0.4 148784 71960 ?        S    09:45   0:00 php /opt/librenms/lnms device:poll 14 -q
librenms   16609  0.3  0.4 146736 70656 ?        S    09:45   0:00 php /opt/librenms/lnms device:poll 9 -q
librenms   16615  0.2  0.4 146736 70580 ?        S    09:45   0:00 php /opt/librenms/lnms device:poll 80 -q
librenms   16616  0.2  0.4 146736 70532 ?        S    09:45   0:00 php /opt/librenms/lnms device:poll 26 -q
If you sum the numbers in the VSZ column, you get 13,422,828 (i.e. 13,4G).
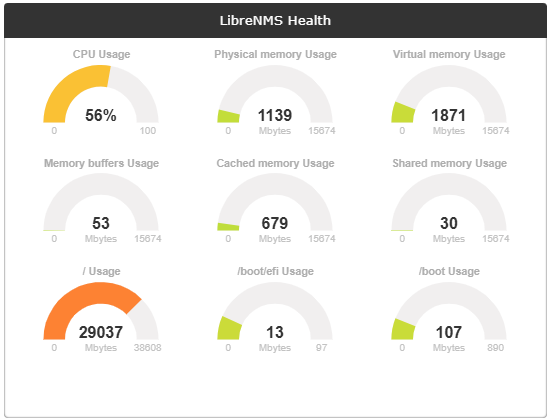
However, the server stats widget shows 1871 Mbytes of virtual memory usage:
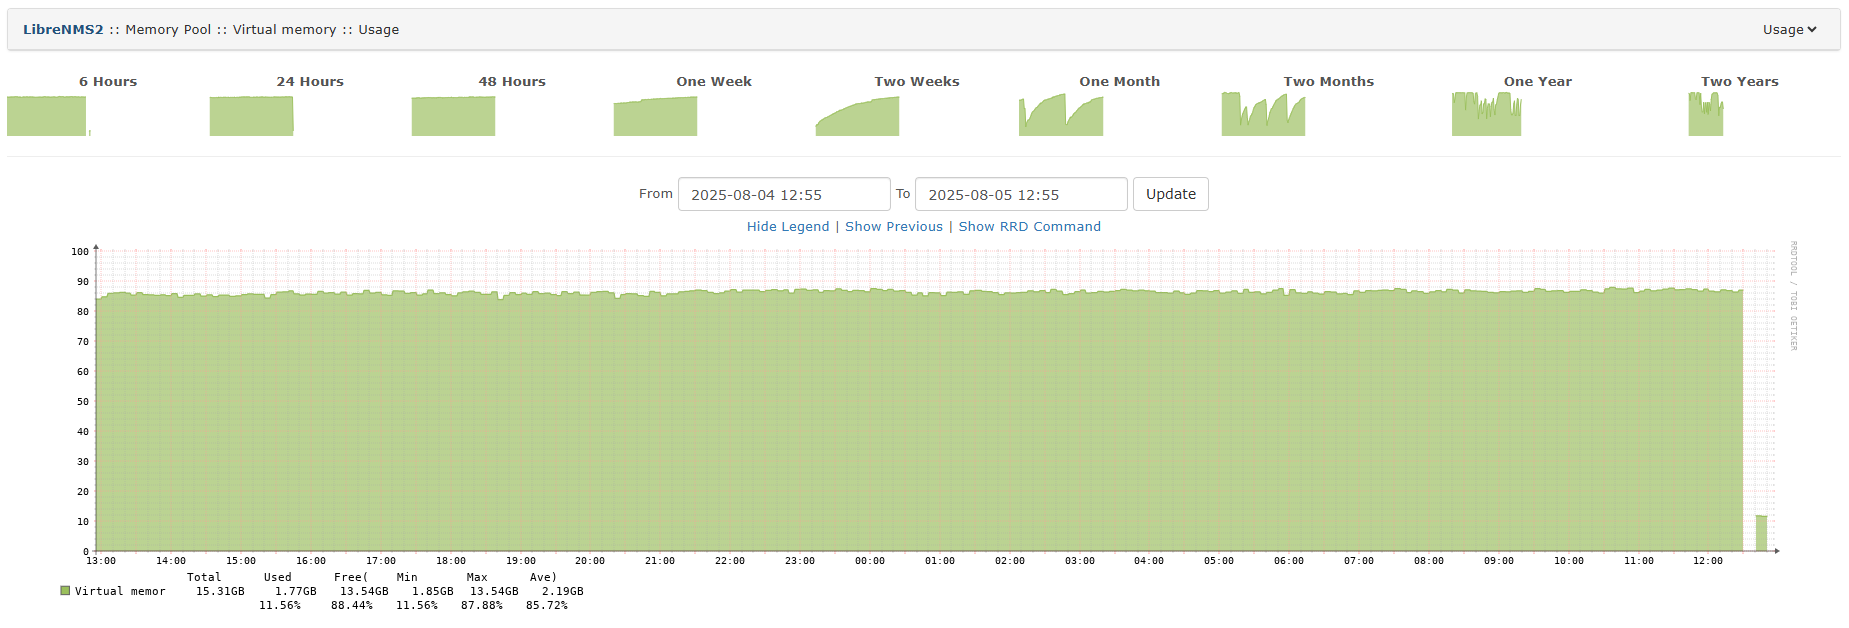
The same number is reported by LibreNMS :: Memory Pool :: Virtual memory :: Usage:
Am I misinterpreting something or is this a bug?
This is the wrong field to even analyze what you are positing is an issue. https://www.baeldung.com/linux/process-memory-management
RSS would be more appropriate.
Total Memory Usage by Included Processes:
11,256 + 35,564 + 56,196 + 58,520 + 55,196 + 70,656 + 74,388 + 70,580 + 70,532 + 71,960 + 272,696 + 4,960 = 852,504 KB (approximately 852.5 MB)
At this snapshot in time.
This topic was automatically closed 90 days after the last reply. New replies are no longer allowed.