lnms poller:billing 13 -vvv
Starting Bill Polling Session …
SQL[select bill_id, bill_name from bills where bill_id = ? [“13”] 1.67ms]
Bill : TEST WIDTRS00001
SQL[SELECT * FROM bill_ports as P, ports as I, devices as D WHERE P.bill_id=? AND I.port_id = P.port_id AND I.ifOperStatus IN (“up”, “dormant”) AND D.device_id = I.device_id AND D.status=1 AND D.poller_group IN (1) [13] 11.86ms]
SQL[SELECT NOW() 2.59ms]
Polling Te0/0/1.3311 (TenGigabitEthernet0/0/1.3311) on my-router.anonymous
SQL[SELECT * from devices WHERE hostname = ? LIMIT 1 [“my-router.anonymous”] 2.99ms]
SQL[select * from devices where device_id = ? limit 1 [138] 9.93ms]
SNMP[‘/usr/bin/snmpget’ ‘-M’ ‘/opt/librenms/mibs:/opt/librenms/mibs/cisco’ ‘-m’ ‘SNMPv2-TC:SNMPv2-MIB:IF-MIB:IP-MIB:TCP-MIB:UDP-MIB:NET-SNMP-VACM-MIB’ ‘-v2c’ ‘-c’ ‘COMMUNITY’ ‘-Oqv’ ‘-t’ ‘2’ ‘udp:HOSTNAME:161’ ‘IF-MIB::ifHCInOctets.20’]
56576425563
SQL[SELECT * from devices WHERE hostname = ? LIMIT 1 [“my-router.anonymous”] 1.8ms]
SNMP[‘/usr/bin/snmpget’ ‘-M’ ‘/opt/librenms/mibs:/opt/librenms/mibs/cisco’ ‘-m’ ‘SNMPv2-TC:SNMPv2-MIB:IF-MIB:IP-MIB:TCP-MIB:UDP-MIB:NET-SNMP-VACM-MIB’ ‘-v2c’ ‘-c’ ‘COMMUNITY’ ‘-Oqv’ ‘-t’ ‘2’ ‘udp:HOSTNAME:161’ ‘IF-MIB::ifHCOutOctets.20’]
95098183818
SQL[SELECT timestamp, in_counter, in_delta, out_counter, out_delta FROM bill_port_counters WHERE port_id = ? AND bill_id = ? [6961,13] 1.62ms]
SQL[SELECT UNIX_TIMESTAMP(CURRENT_TIMESTAMP()) - UNIX_TIMESTAMP(‘2026-10-08 10:39:56’) 1.02ms]
****2026-10-08 10:41:24: TEST WIDTRS00001 Billing DB SNMP counters received.
in_measurement: 56576425563 out_measurement: 95098183818
The data types are. in_measurement:integer and out_measurement: integer
IN_delta: 56576425563 OUT_delta: 95098183818
Last_IN_delta: 56575949493 last_OUT_delta: 95094725750
Nice, valid counters ‘in/out_measurement’, lets use them
SQL[UPDATE bill_port_counters set timestamp=?,in_counter=?,out_counter=?,in_delta=?,out_delta=? WHERE port_id=‘6961’ AND bill_id=‘13’ [“2026-10-08 10:41:24”,“56576425563”,“95098183818”,“56576425563”,“95098183818”] 2.45ms]
SQL[SELECT timestamp,delta,in_delta,out_delta FROM bill_data WHERE bill_id = ? ORDER BY timestamp DESC LIMIT 1 [13] 1.42ms]
SQL[SELECT UNIX_TIMESTAMP(CURRENT_TIMESTAMP()) - UNIX_TIMESTAMP(‘2026-10-08 10:39:56’) 4.32ms]
SQL[SELECT COUNT(*) FROM bill_ports as P, ports as I, devices as D WHERE P.bill_id=? AND I.port_id = P.port_id AND D.device_id = I.device_id AND D.poller_group IN (1) [13] 1.33ms]
SQL[INSERT IGNORE INTO bill_data (bill_id,timestamp,period,delta,in_delta,out_delta) VALUES (:bill_id,:timestamp,:period,:delta,:in_delta,:out_delta) {“bill_id”:13,“timestamp”:“2026-10-08 10:41:24”,“period”:88,“delta”:“151674609381”,“in_delta”:“56576425563”,“out_delta”:“95098183818”} 1.92ms]
Completed in 0.191 sec
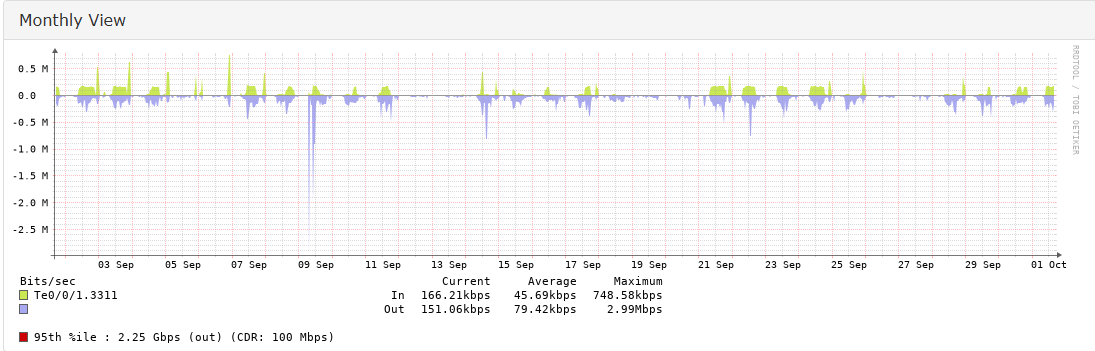
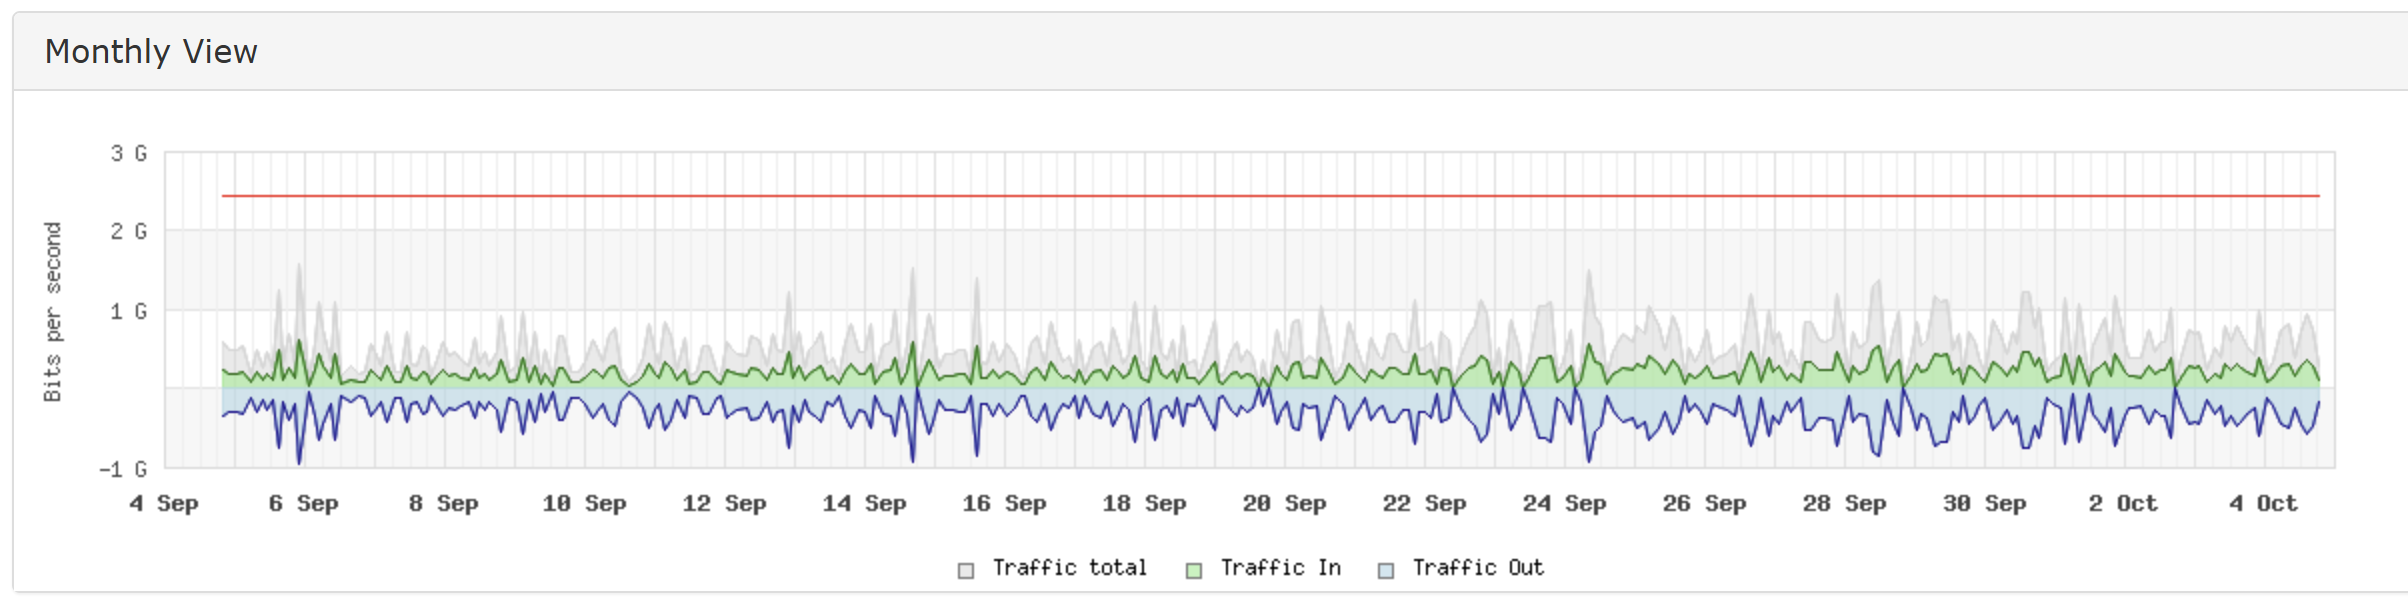
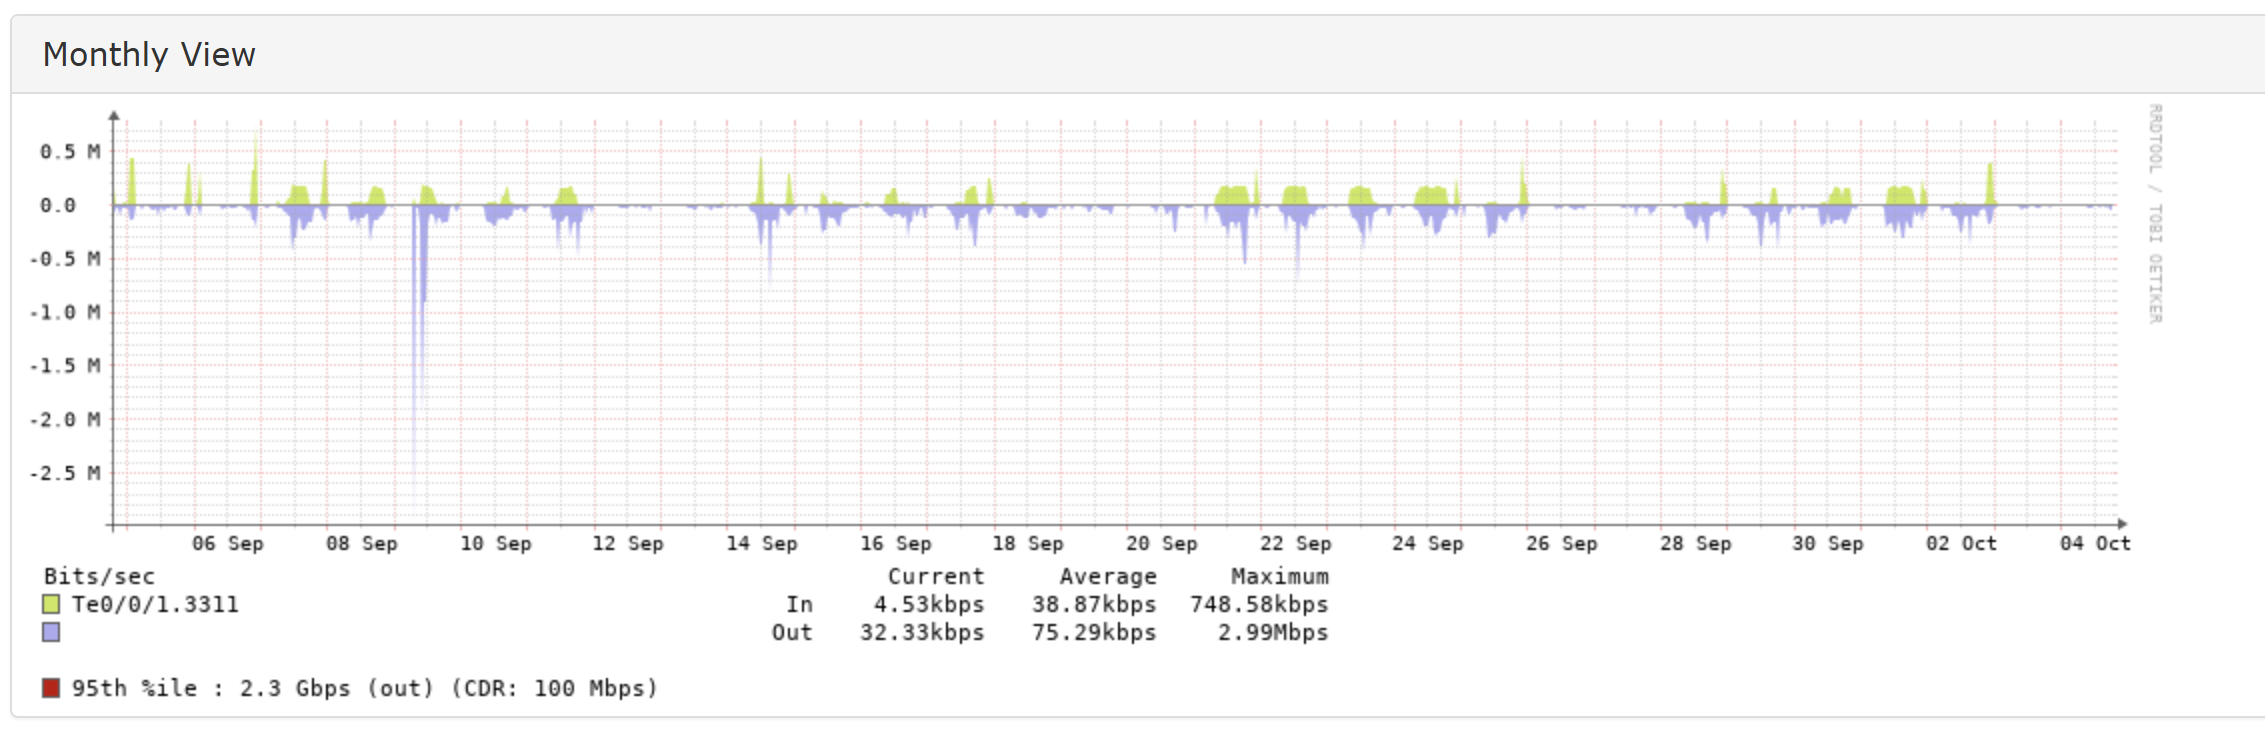
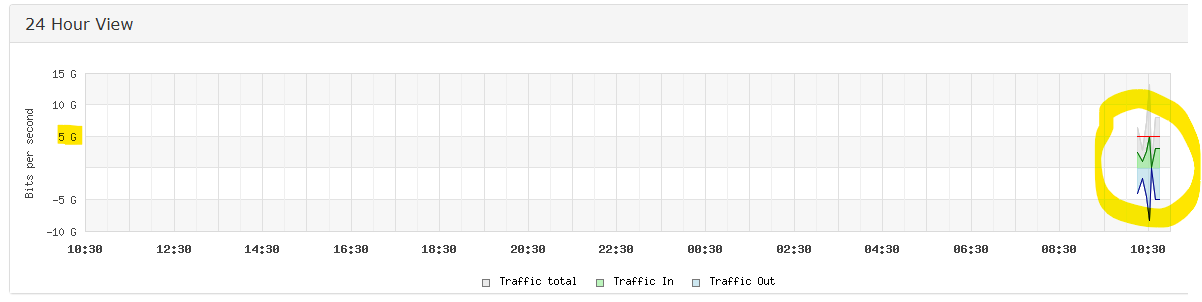
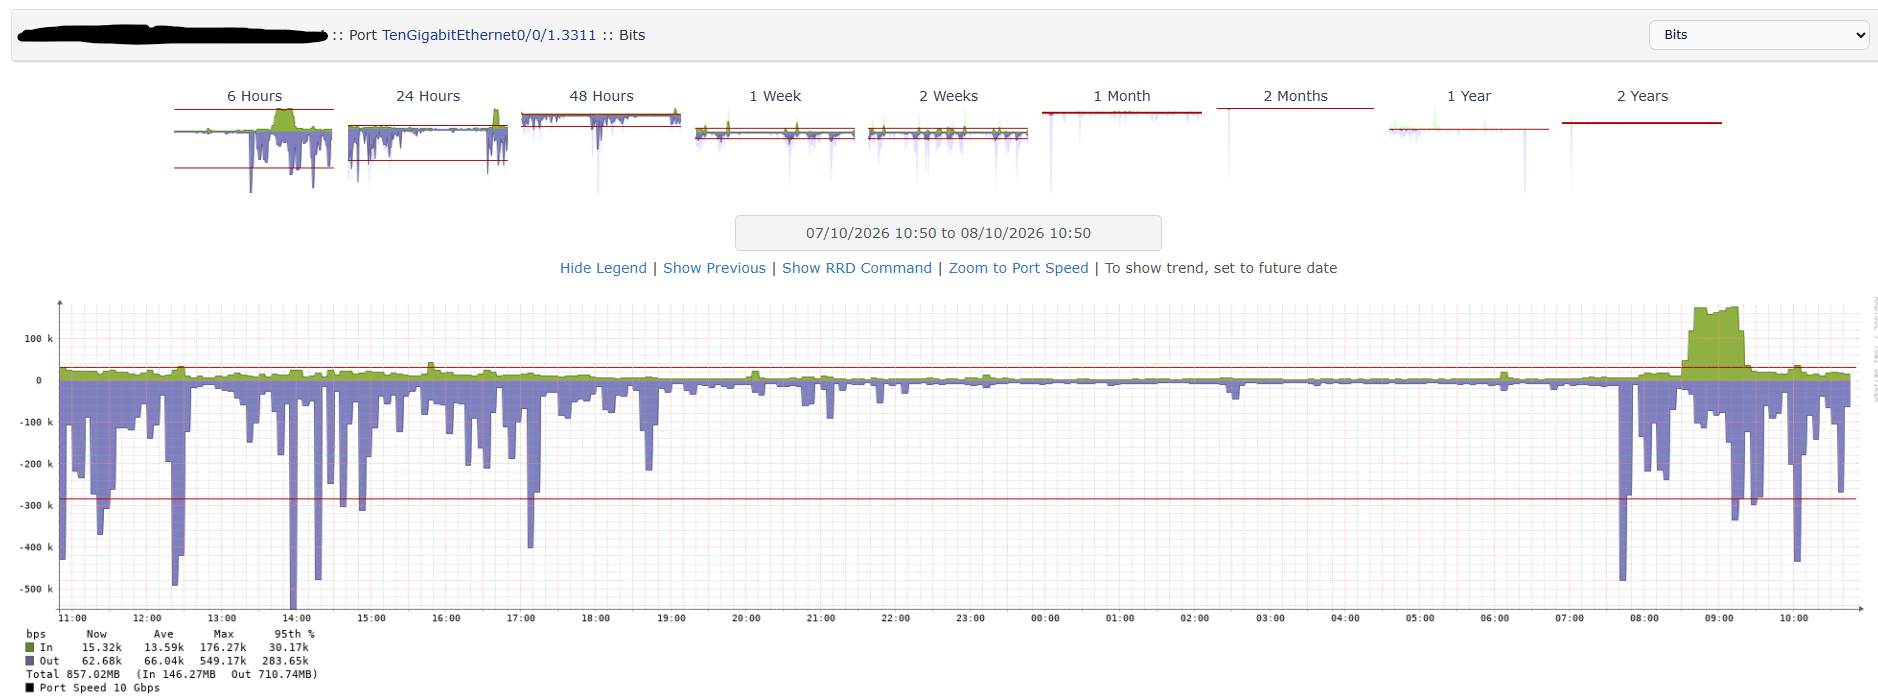
For the test, I reset the billing system in question. It looks as though it’s calculating the following for me:
I’m not sure if this information is enough for you. Please don’t hesitate to ask me for further details if you need them.
Regards,