I have just installed my first LibreNMS server and so far so good.
I am monitoring a number of Ubiquiti and MikroTik devices for my WISP but one item is causing me some issues.
I have a couple of MikroTik Router OS devices which run on batteries, solar panels and wind turbines at remote locations so as you can imagine, keeping an eye on the voltage is very important.
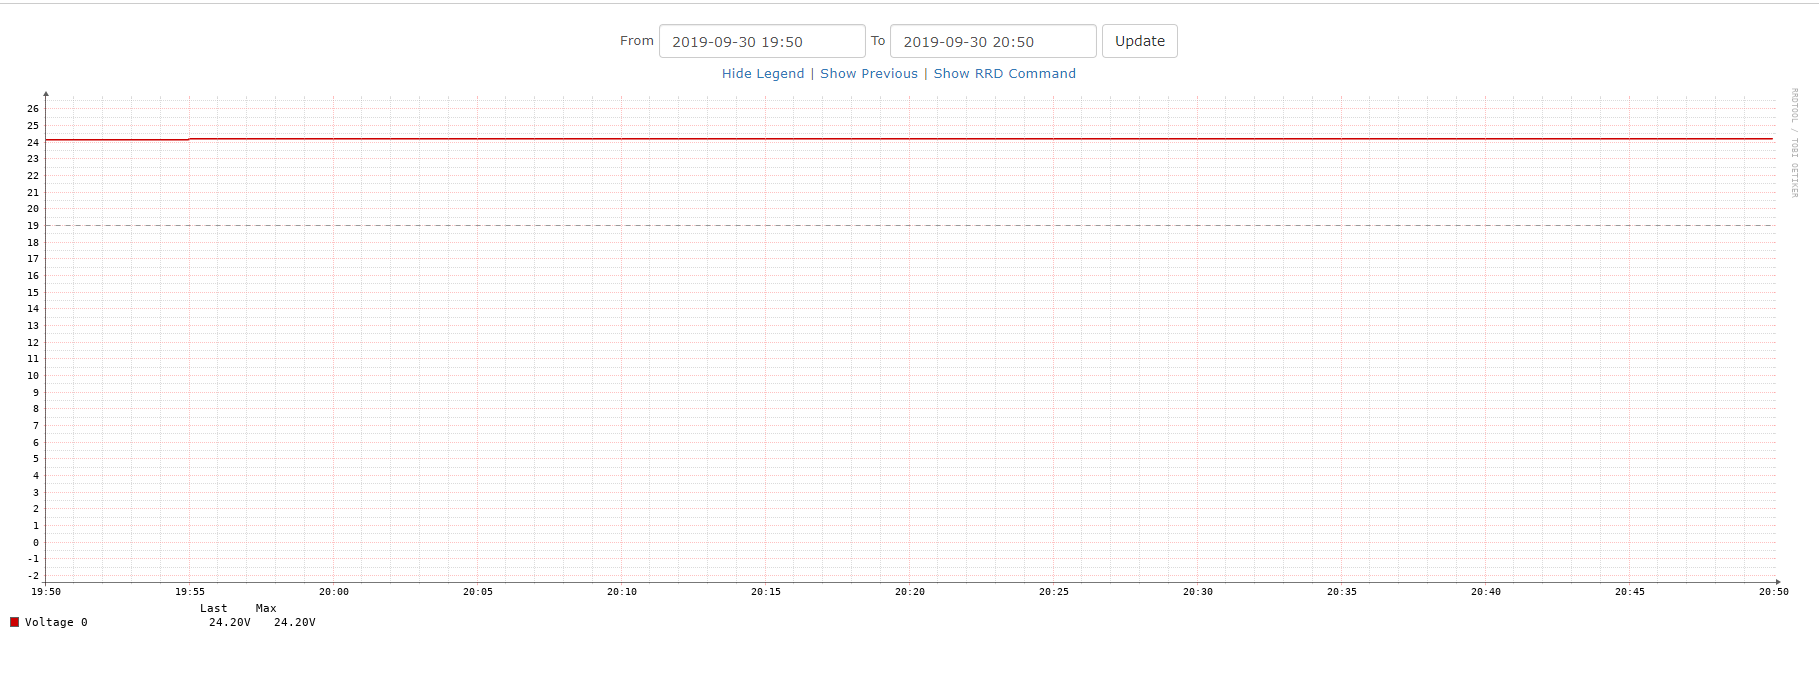
Libe is measuring the input voltage just fine, but eh graph it creates has a massive range on the Y axis.
The Graph ranges from -2V to +28V, I only need it for about +20 to +26, but cannot see an option to change this.
attached is a screenshot of the graph, as you can see it’s not very useful as it doesnt show the fluctuations in the voltage very clearly.
If anyone has any tips I’d love to hear them. Thanks.