Debugging graph spikes from high latency links

Hi All,

I have to reluctantly bring up graph spikes again, I know it’s a challenge, but they are causing me such issues I need to find a resolution and am prepared to dig deep.

TL;DR appears high latency causes it, some minor poller gaps, accumulated missed polling data doesn’t account for the spikes, happens across various Cisco and Palo devices at these remote sites.

I’m seeing graphs spikes which generally appear after brief polling gaps which I suspect are from latency over a satellite link. I’ve tried all the usual things but these particular latent sites continue to evade my attempts. If anyone is able to assist me in identifying relevant tests and debugging data so we can try and find a cause/resolution - I’m ready to go!

Following this: FAQ - LibreNMS Docs, a few things which I have determined:

  1. I don’t see spikes on low latency links.
  2. Normal traffic on any port on the spiking devices never exceeds 15Mbit/s - so the spike being the traffic accumulated since the last successful poll doesn’t explain the spikes.
  3. rrdtune has been tried several ways, and regardless the spikes never exceed the interface speed - they are often around half of it.
  4. I see the spikes sometimes in packet counters, not just traffic - and they are equally as unrealistic numbers.
  5. I see traffic spikes sometimes on Cisco VLAN interfaces, which don’t have traditional traffic flow and sit constant at 4Kbit/s - again, it’s not accumulated counters.
  6. removespikes.php v1.1 removes them if I get to them in time - if they roll down to more historical timeframes, I seem stuck with them. Each day I pull up my mini graphs page and the CLI and get busy.

For some context - this is the typical traffic flowing around these sites:

Polling:

To me it seems related to some polling element/interruption and not counter overflows or bogus device SNMP implementations. Poller debug output is here: poller - LibreNMS

image

It will often affect connected switches on the opposing interface, but sometimes random other devices at the same site (different Cisco switches, Palo Alto firewalls etc.).

On the main offender, this is the poller performance:

Effects:

A typical spike looks like this:

Here is a graph that shows the gaps where spikes often appear immediately after. In this case it spiked on the first one (removed), but that interface didn’t spike on the second one, though there are no gaps or spikes in the packets graphs:


The second gap has caused many some other interfaces on the switch to spike:

Workarounds:

I use removespikes.php v1.1 (not v1.0 shipped with LibreNMS as I’m unable to get that to even run - and either stdddev or variance will find and remove the graphs:

~$ php /tmp/removespikes.php -R=/opt/librenms/rrd/xxxxx/port-id267.rrd -M=stddev --backup
NOTE: Using RRDtool Version 1.7.0
NOTE: Creating XML file '/tmp/port-id267.dump.1718055493' from '/opt/librenms/rrd/xxxxx/port-id267.rrd'
NOTE: RRDfile '/opt/librenms/rrd/xxxxx/port-id267.rrd' backed up to '/tmp/port-id267.backup.1718055493.rrd'
NOTE: Searching for Spikes in XML file '/tmp/port-id267.dump.1718055493'
NOTE: Backing Up '/opt/librenms/rrd/xxxxx/port-id267.rrd' to '/tmp/port-id267.rrd.1718055493'
NOTE: Re-Importing '/tmp/port-id267.dump.1718055493' to '/opt/librenms/rrd/xxxxx/port-id267.rrd'

Here’s a before an after a port channel between a Cisco and Palo:

… stddev spike removal:


Sometimes a gap is before the spike, but that’s not consistent across all interfaces.

Other Investigations:

This became an issue when the site moved to Satellite from cellular, but also the movement of a cisco 3560 in to the flow of all traffic which was previously on the edge of the network. It is fully patched to recommended release, but it did seem odd and made me find this: Weird spikes in network traffic on cisco 3650 and 3850 switches - #19 by rmahurin

~$ ./validate.php
====================================
Component | Version
--------- | -------
LibreNMS  | 21.5.1-32-g20c44b85c
DB Schema | 2021_06_11_084830_slas_add_rtt_field (210)
PHP       | 7.3.28-2+ubuntu18.04.1+deb.sury.org+1
Python    | 3.6.9
MySQL     | 10.5.10-MariaDB-1:10.5.10+maria~bionic
RRDTool   | 1.7.0
SNMP      | NET-SNMP 5.7.3
====================================

[OK]    Composer Version: 2.1.3
[OK]    Dependencies up-to-date.
[OK]    Database connection successful
[OK]    Database schema correct

Any tips, similar stories, or beer appreciated!

Have you read this?

Thanks @paulierco yes I included that in my post and have responded to the suggestions it poses - though none of them really solve it for me.

You could try increasing the snmp timeouts. (this will increase poller time)

I’m very curious if increasing snmp timeout will somehow fix this problem. Please let us know the results.

Thanks @murrant.

I have decided to change only the main troublesome device at site and left the rest to see if it makes a difference.

Based on: Configuration Docs - LibreNMS Docs and Performance - LibreNMS Docs

I have changed repeaters to 70, and timeout to 3, which was previously using defaults of 1 second and zero repeaters:

~$ ./lnms config:get snmp
array (
----
  'max_repeaters' => 0,
  'timeout' => 1,
----

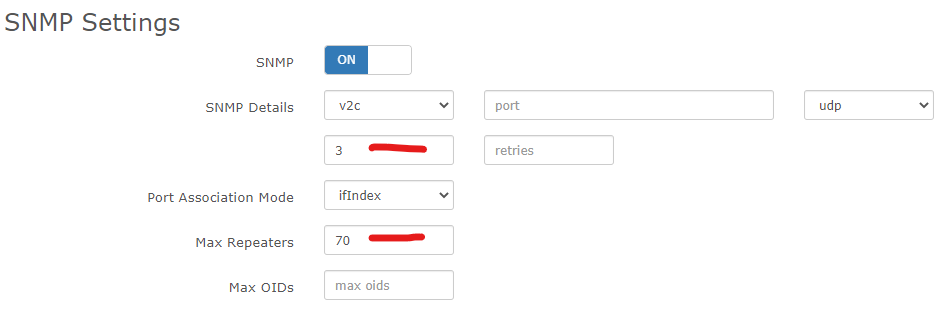
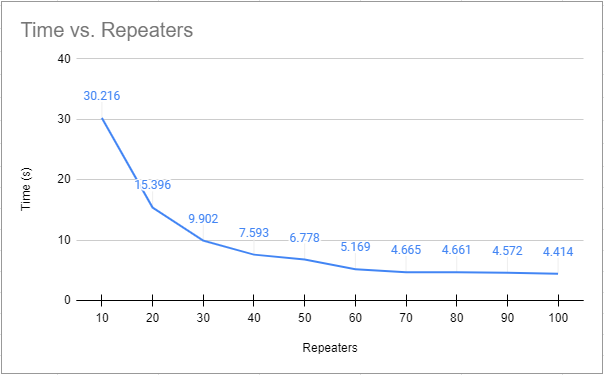
Some max repeaters testing on this device:
image

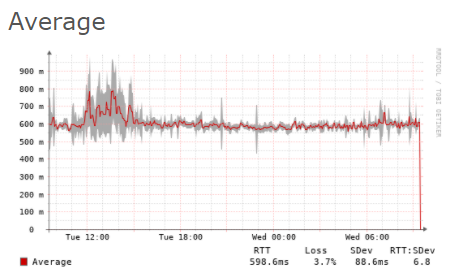
In good times and while testing repeaters above, the latency on the link is pretty consistent, and the connection is stable:

~$ sudo sudo ping -f 10.x.x.x.x -c 500
PING 10.x.x.x (10.x.x.x.x) 56(84) bytes of data.

--- 10.x.x.x.x ping statistics ---
500 packets transmitted, 500 received, 0% packet loss, time 8094ms
rtt min/avg/max/mdev = 528.096/595.453/763.771/36.694 ms, pipe 46, ipg/ewma 16.221/615.453 ms

However I’ve found one device with working smokeping from the time of the last spike, and it’s evident there is congestion and packet loss:

image


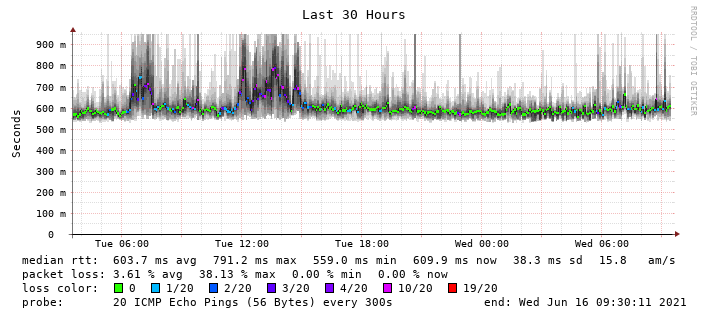
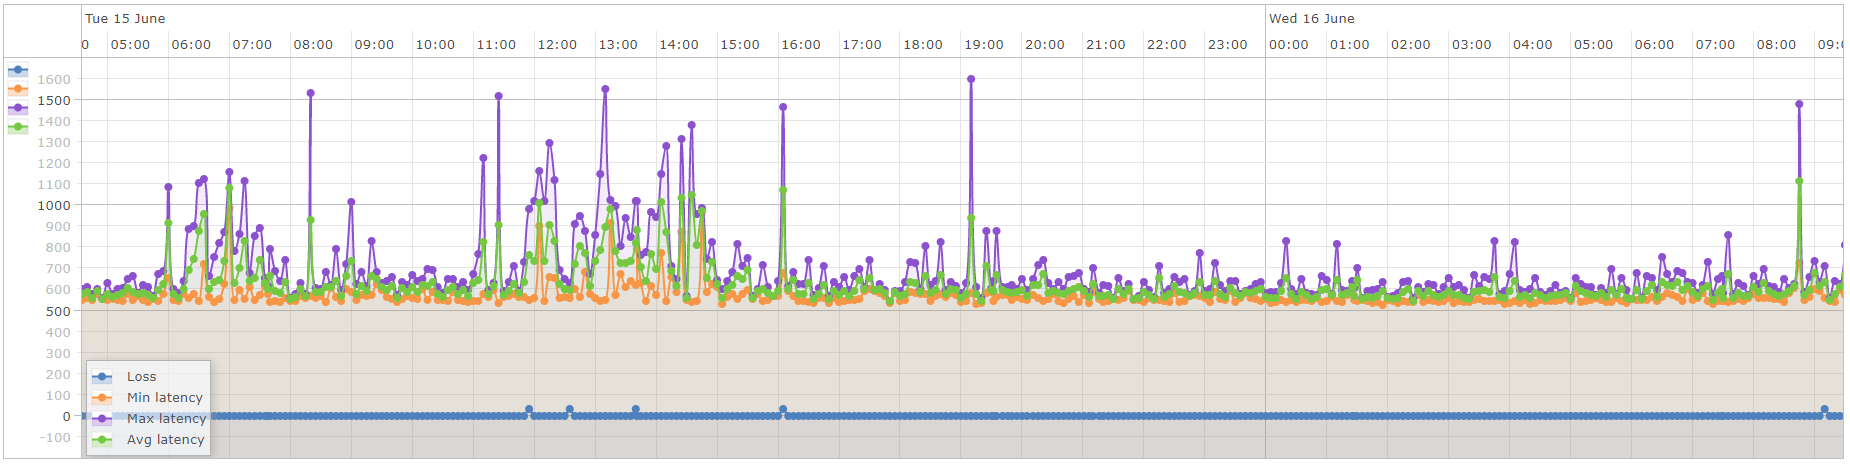
Given this will be inevitable, I’m focusing on how to keep his from destroying my graphs as best as possible.

2 Likes

First observation is changing the max repeaters value has caused a significant reduction (~60%) in poller times for this Cisco 3560 (16 ports):

Hoping that may reduce some of the effects, though if it’s packet loss causing issues it may need some other strategies.

I will continue to monitor this, the smokeping stats which I’ve now fixed for that host, and any graph spikes across the other devices at the same site.

Just prior to making this change I’ve seen a spike on all active ports on a Palo Alto firewall upstream of this main device, which is not visible on any other device and no gaps in any device graphs. Smokeping stats from that exact time show clean with no packet loss.


Just to update, as yet I’ve seen no spikes on this main device, and only one device spiked on all interfaces with a polling gap.

The latency/packet loss has been much better recently though, so I’m waiting for some choppier waters to see how things respond - still with the one device on new timeout settings and the rest default.

Wrapping up on this, and as is often the case: I no longer have an environment to further test this. The problem site is now on satellite backup and cellular primary.

After changing the above settings on the main core device, I no longer had any issues with it directly. I had some minor spikes on some devices, but nothing like I was seeing before - so have been unable to truly catch it in the act, make changes, and compare. I had one device on the extreme edge of the network in question which continued to show some isolated spikes.

For my case I think the max repeaters was the biggest help to reduce the window of time taken to ingest bulk stats from interfaces. It appears that some minor packet loss on a 2+ minute process was highly likely to drop some data, and obtaining it all in shorter period may have simply reduced the probability of it hitting any packet loss.

This topic was automatically closed 91 days after the last reply. New replies are no longer allowed.