I found some other posts for this, for example on reddit and so I came here to get this fixed. In my company we rely on the performance and statistics data that LibreNMS is collecting and presenting in nice graphs for us. We mostly need the graphs to track down issues with servers and to provide customers statistics about their servers.
We’re monitoring about 700 servers and are now facing the problem that snmp marks them down. To say it right away: We don’t use LibreNMS for icinga like monitoring. We don’t receive any notifications from it. We only use it for the collected data.
The problem is caused by the discovery cronjob. It takes mostly 4 minutes to query a host. Some slow devices like switches can take about 20 minutes to be finished. This way every 6 hours a new discovery process is started an then like 4 or 5 are running parallel. The problem is then that the polling is timing out (for LibreNMS) an it marks a host as down. Unfortunately the graphs will now show gaps and this is very bad in our usecase. After 45 minutes to two hours a host is marked up again and the graphs will continue to show data.
I now would like to be able to set globally, that hosts are only marked down when ping times out in a given period of time. We still want to poll data using snmp from hosts but they should only be marked down by ping.
What I’ve tried so far:
I switched to the discovery-wrapper.py script using 2 threads => is stil running way too long
I incresed the snmp timeout in the config.php to 5 seconds with 2 retries => Hosts still marked down
I hope it’s more clear now what the problem is. I think most people asking this were misunderstood. As a summary:
Collect data using snmp, mark hosts down using ping.
I’m running the polling script with 24threads every 3 minutes. From what I see using top: The polling is done in about 2 minutes.
Also we need more info like how many devices are your monitoring and ports ect…
We’re monitoring about 700 servers
To provide you exact numbers: 620 devices and 9515 ports
And what kinda hardware specs are you running LibreNMS on?
2x Intel(R) Xeon(R) CPU E5-2620 v2 @ 2.10GHz together 24 cores
32GB RAM, 24GB are free
The RRDs and the mysql database are on a intel-ssd-750-800gb nvme SSD
The OS and librenms are on two Intel 520 480GB SSDs combined using a RAID1
The OS is Debian 9
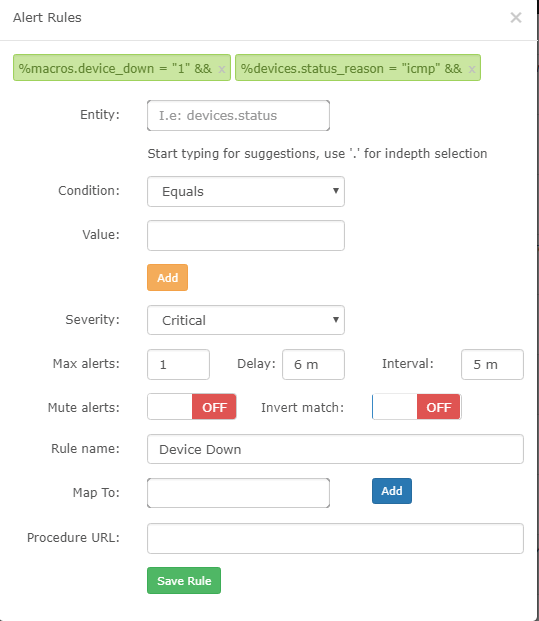
Then for me, I changed the default alert rule for “device down” to
Have you try to disable discovery module that you don’t need ?
I checked the modules and it seems that they are the default values but the fit perfectly our needs. What we haven’t done is to restrict modules to different devices. Because this would cost us about three complete working days
What kind of server and switch do you have ?
Our hardware machines are mostly supermicro servers. Most of them are hosting about 500 VMs together which again can run on one of 4 different linux distributions with different OS levels. Lots of Uniper switches, IBM SAN and so on. Plenty of everything.
I hope you don’t think to do this in GUI ?
Do this in config.php base on OS, like this:
$config[‘os’][‘dlink’][‘discovery_modules’][‘ipv6-addresses’] = 0;
I come back to you 4min discovering for one device. Is your device are overloaded ?
Can you show a Poller Modules Performance graph for one of them ?
Now I’m facing a nice new issue:
I reran discovery on a server because 3 days ago librenms kicked out some sensors which are needed. I disabled the discovery cronjob on Friday to avoid gaps in the graphs. As soon as I started the discovery for only that host, librenms marked the host as down via snmp. After that I reduced the discovery modules for debian and tried to run the discovery again, but it just gives me the following:
The host is still down, for 25minutes already which again means gaps in the graphs…
Is there a way to manually mark the host as up?
@Kevin_Krumm
It seems that the alert rule does not work…
Update:
The server was marked up after 45minutes and 2 seconds.
Update 2:
It turned out the sensors discovery modul is causing my issues. I reran it on the mentioned host because the sensors were kicked out from the host. I tried a rerun before with the storage module because this was kicked out too. The storage discovery only took 0.529 seconds to finish wich directly brang back the storage graph for that host. But the run of the sensors module took 340.5 seconds and it also marked the host down again.
MySQL Optimisation
innodb_flush_log_at_trx_commit = 0
Optimise poller-wrapper
followed the rule and increased to 48
I’m now starting playing around with the polling and discovery modules.
I didn’t setup RRD Cached because io load doesn’t bother me due to the nvme SSD and we would like to have the graphs as soon as possible.
Beside the performance optimisation:
Is it usual that the sensor discovery takes more than five minutes? The host I checked above is a quite powerful linux server.
I now have Rrd caching up and running. During polling the server load is now reduced by one (from 5 to 4).
But sensors discovery still takes about 40minutes which causes the server to be marked as down and causes gaps in my graphs. Am I the only one who is facing such long discovery runs? Applications took about 10 minutes. I threw this away because we’re not using it anyway. But I really would like to use sensors which is unfortunately not usable for me like this.
In the following I post the output of the sensors discovery. Here I postetd the output of a full discovery run without sensors and unneeded modules.
/discovery.php -h hostname -m sensors
LibreNMS Discovery
hostname 874 linux
I’m talking about the discovery. I know the difference between discovery and polling. I just told you about the polling to show the impact of the rrd caching to you.
Maybe I should have make it more clear in the discovery output: both outputs are from the same server. Let’s call him server-01. I have seen the sensors modul taking so long on other servers. But I don’t want to run this again on them because this causes gaps in graphs.
The discovery, as you can see in the given output on pastebin, is very fast. But the discovery of the sensors is taking 40 minutes. It’s the same device that I run both discoveries on.
I understand that. Im just saying that the discovery won’t poll the data and graph it that’s the poller. So the discovery that is taking “40 min” to run is not whats causing the “gaps” in the graphs.
I understand that. Im just saying that the discovery won’t poll the data and graph it that’s the poller. So the discovery that is taking “40 min” to run is not whats causing the “gaps” in the graphs.
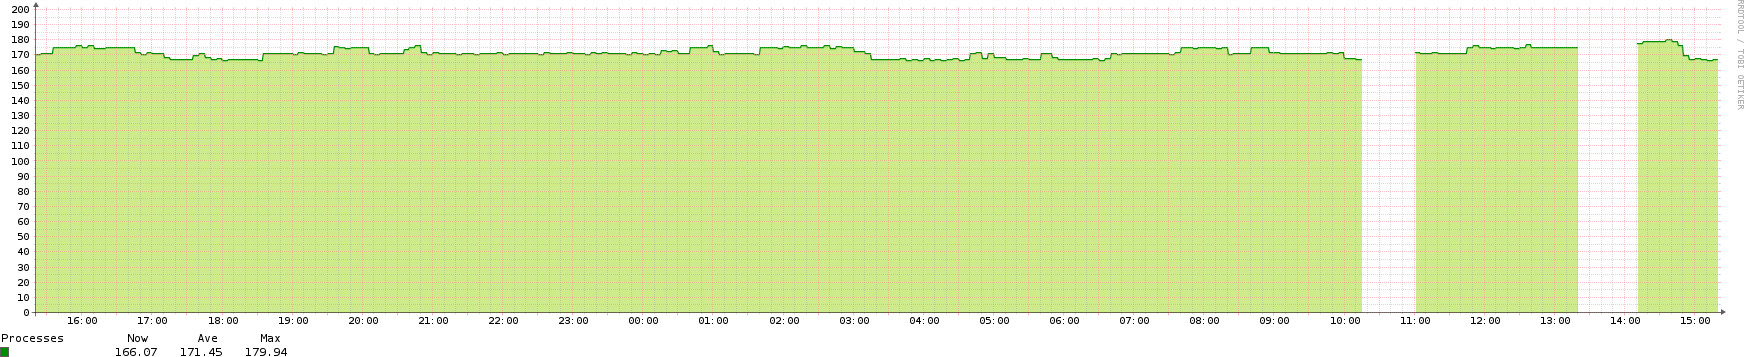
I have the feeling that the long discovery is blocking the polling in this case. The server-01 is a test machine exactly for this. When I start the sensors discovery I get a gap of exactly this time in my graph. In the following I uploaded a screenshot of the processes graph of this server from today.
These gaps are exactly during the sensors discovery run.
Here I post you the eventlog of this host too:
2017-11-06 14:10:24 System Polling took longer than 5 minutes! This will cause gaps in graphs.
2017-11-06 14:10:23 System Device status changed to Up from snmp check.
2017-11-06 14:10:22 System Polling took longer than 5 minutes! This will cause gaps in graphs.
2017-11-06 14:10:22 System Polling took longer than 5 minutes! This will cause gaps in graphs.
2017-11-06 14:10:21 System Polling took longer than 5 minutes! This will cause gaps in graphs.
2017-11-06 14:10:21 System Device status changed to Up from snmp check.
2017-11-06 14:10:21 System Device status changed to Up from snmp check.
2017-11-06 14:10:20 System Device status changed to Up from snmp check.
2017-11-06 14:10:20 System Device status changed to Up from snmp check.
2017-11-06 14:07:21 System Device status changed to Down from snmp check.
2017-11-06 14:02:21 System Device status changed to Down from snmp check.
2017-11-06 13:57:22 System Device status changed to Down from snmp check.
2017-11-06 13:52:26 System Device status changed to Down from snmp check.
2017-11-06 13:47:23 System Device status changed to Down from snmp check.
2017-11-06 11:05:01 System Device status changed to Up from snmp check.
2017-11-06 11:02:24 System Device status changed to Down from snmp check.
2017-11-06 11:02:23 System Polling took longer than 5 minutes! This will cause gaps in graphs.
2017-11-06 11:02:23 System Polling took longer than 5 minutes! This will cause gaps in graphs.
2017-11-06 11:02:22 System Device status changed to Up from snmp check.
2017-11-06 11:02:22 System Device status changed to Up from snmp check.
2017-11-06 11:02:21 System Device status changed to Up from snmp check.
2017-11-06 11:02:20 System Polling took longer than 5 minutes! This will cause gaps in graphs.
2017-11-06 11:02:19 System Device status changed to Up from snmp check.
2017-11-06 10:57:24 System Device status changed to Down from snmp check.
2017-11-06 10:52:27 System Device status changed to Down from snmp check.
2017-11-06 10:47:20 System Device status changed to Down from snmp check.
2017-11-06 10:42:25 System Device status changed to Down from snmp check.
2017-11-06 05:05:23 System Temperature Physical id 0 under threshold: 36 (< 39.9 )
My poller-history provides only the data from the last poll. I don’t know if that’s common.
Under normal circumstances the polling of the server-01 is:
server-01 2017-11-06 15:50:21 General 1.11
The longest polls are from our switches:
switch-01 2017-11-06 15:54:18 General 257.62
switch-02 2017-11-06 15:52:17 General 136.70
switch-03 2017-11-06 15:51:38 General 97.11
switch-04 2017-11-06 15:51:31 General 90.65
switch-05 2017-11-06 15:51:05 General 64.55
switch-06 2017-11-06 15:51:04 General 63.59
switch-07 2017-11-06 15:51:04 General 62.98
switch-08 2017-11-06 15:51:03 General 62.45
switch-09 2017-11-06 15:51:03 General 62.28
switch-10 2017-11-06 15:51:03 General 62.09
switch-11 2017-11-06 15:51:03 General 61.93
switch-12 2017-11-06 15:51:03 General 61.84
switch-13 2017-11-06 15:50:55 General 53.98
switch-14 2017-11-06 15:50:54 General 52.96
switch-15 2017-11-06 15:50:54 General 52.93
switch-16 2017-11-06 15:50:53 General 52.51
switch-17 2017-11-06 15:50:53 General 52.48
switch-18 2017-11-06 15:50:53 General 52.47
switch-19 2017-11-06 15:50:53 General 52.14
switch-20 2017-11-06 15:50:53 General 52.10
switch-21 2017-11-06 15:50:53 General 52.08
switch-22 2017-11-06 15:50:53 General 52.02
switch-23 2017-11-06 15:50:53 General 51.66
switch-24 2017-11-06 15:50:52 General 51.64
switch-25 2017-11-06 15:50:52 General 51.56
switch-26 2017-11-06 15:50:51 General 50.24
switch-27 2017-11-06 15:50:33 General 31.84
switch-28 2017-11-06 15:55:29 General 27.79
switch-29 2017-11-06 15:55:21 General 19.20
switch-30 2017-11-06 15:55:18 General 16.03
switch-31 2017-11-06 15:55:17 General 15.58
switch-32 2017-11-06 15:55:15 General 13.10
switch-33 2017-11-06 15:55:12 General 10.78
switch-34 2017-11-06 15:55:12 General 10.10
In the meantime you can find here the polling history of server-01 from the timeperiod around the two sensors discovery runs.
What I forgot to mention too is that I disabled the discovery cronjob to ensure complete graphs. So when I run the given discovery jobs, I start them manually for the one given host.
daylicron
Ok, this is a hell of a boost. It reduced the polling of a switchstack (5 switches) heavily:
Before:
switch-01 2017-11-06 15:54:18 General 257.62
After:
switch-01 2017-11-06 16:16:34 General 93.01
I now gained a heavily improved polling for our switches which deacreased their load too. Thanks for this again.
Unfortunately this didn’t help me with my sensors discovery issue. I reran the sensor discovery again and it took me the same amount of time (2702 seconds for the module). There is a gap in the graphs for the same amount of time too.
I checked the load on server-01 during the sensors discovery and it stayed 0 during the whole run.
I’m running LibreNMS on 1.33 by the way. I hoped the refactoring of the discovery would solve my problem, but it didn’t help.
In addition I renamed the topic to “gaps in graphs during sensors discovery run” because this is actually my problem now. Although I would like to see the feature to mark devices down via icmp only.
I’m now back running the discovery as LibreNMS advises it per default. It is running every 6 hours with two workers and finishes all 621 devices in 1590 seconds. Mind that I disabled the sensors module globally.
Is there a way to speed up the sensors discovery module? Like refactoring or something like that? It takes 2709 seconds to finish, which is almost twice the discovery run with all devices without the sensors module.