I’m having some issues with incorrect values being displayed on graphs of F5 port-channels, and I thought a workaround would be to create a graph that displays multiple ports. Searching led me to this post.
From that post I was able to figure out that I need the type of multiport_bits to get what I need, but I’m unable to figure out how to get it working in the graphs widget. Since multiport_bits is not an option, I’ve been attempting to modify the inputs of the Port:Bits graph to no avail.
We don’t have multi bits available in the graph widget iirc. You could just use the standard image widget and use the full url to the image you want.
As an example, a graph url for storage for me is: graph.php?id=388&type=storage_usage&to=-300&from=-6h&height=300&width=1512 so I could just use that in the image url. Make sure you change the to + from to values you want to see, by default the graph url will be hardcoded with a particular datetime. However in my example you can see I’ve said the graph should start -6 hours ago up until -300 seconds.
For anyone that finds this in the future, here’s the process I followed:
Get the port id by hovering over each port and looking for port=[number] in the URL at the bottom of the browser. Alternately you can click into the port and it will show in the address bar.
Go here - https://[your librenms URL]/graphs/id=[comma separated list of ports you want to graph]/type=multiport_bits
Right click the image and select “Copy Image Location”
Add the widget “External Images” to the dashboard
Paste the link you copied above in to the “Image URL” box, and delete everything before “graph”. The result should look like this:
graph.php?id=1217%2C1218&type=multiport_bits&from=1480621200&to=1480707600&height=317.66666666667&width=1664.1
Change the from= and to= values in the URL to the date range you want to display. For instance, “from-1d&to-300” will display from one day ago to five minutes ago.
In order to make the text scale with the size of the widget window append, “&absolute=1” to the end of the URL.
If you want clicking the image to result in a larger image opening, paste that into the, “Target URL” box. I adjusted my from/to so that it would open to a seven day view.
Apologies if this is all really obvious, I just didn’t want to be like DenverCoder9.
This works quite well for a router of mine, that load-balances two internet connections. The only downside is, that in contrast to the normal port bits, I don’t get a “total” line under the graph which would be quite informative.
Is there a way to add this to to the RRD command that creates the graph? Should be a simple VDEF.
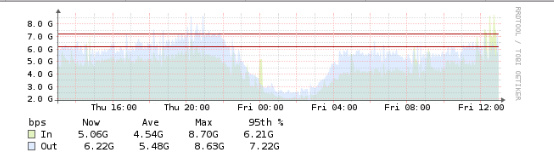
Hello Guys! Is there any way to alter colors of multiport_bits graphs? Here is the graph created via the following link https://libre/graphs/id=45236,45294/type=multiport_bits
If I use it in Weathermap it looks even more transparent
They seem to be hardcoded in html/includes/graphs/multiport/bits.inc.php
It would be great if you update to use the $config[‘graph_colours’] colors and send a pull request.

