The memory had been cleaned with echo 3 > /proc/sys/vm/drop_caches, but started to increase steadily again ever since. We’re currently running the following version on CentOS 7:
Version
1.34 - Sat Nov 25 2017 06:48:49 GMT-0500
DB Schema
#217
Web Server
nginx/1.10.2
PHP
7.0.22
MySQL
5.5.52-MariaDB
RRDtool
1.6.0
There was one element from the configuration validation that I noticed hadn’t been cought, which was that php-fpm was running under user apache, which hadn’t been added to the librenms group. I’ve just corrected that part, but was there any chance it was related?
Also, we’re still having issues with RRD defunct processes that we have to clean up on a regular basis, as per this post:
The last time we cleaned them up we had 17 of them (Dec. 21st) and we’re up to 16 again. Any other clue as to what could be causing this? Unfortunately, we hadn’t been able to find anything in the previous thread.
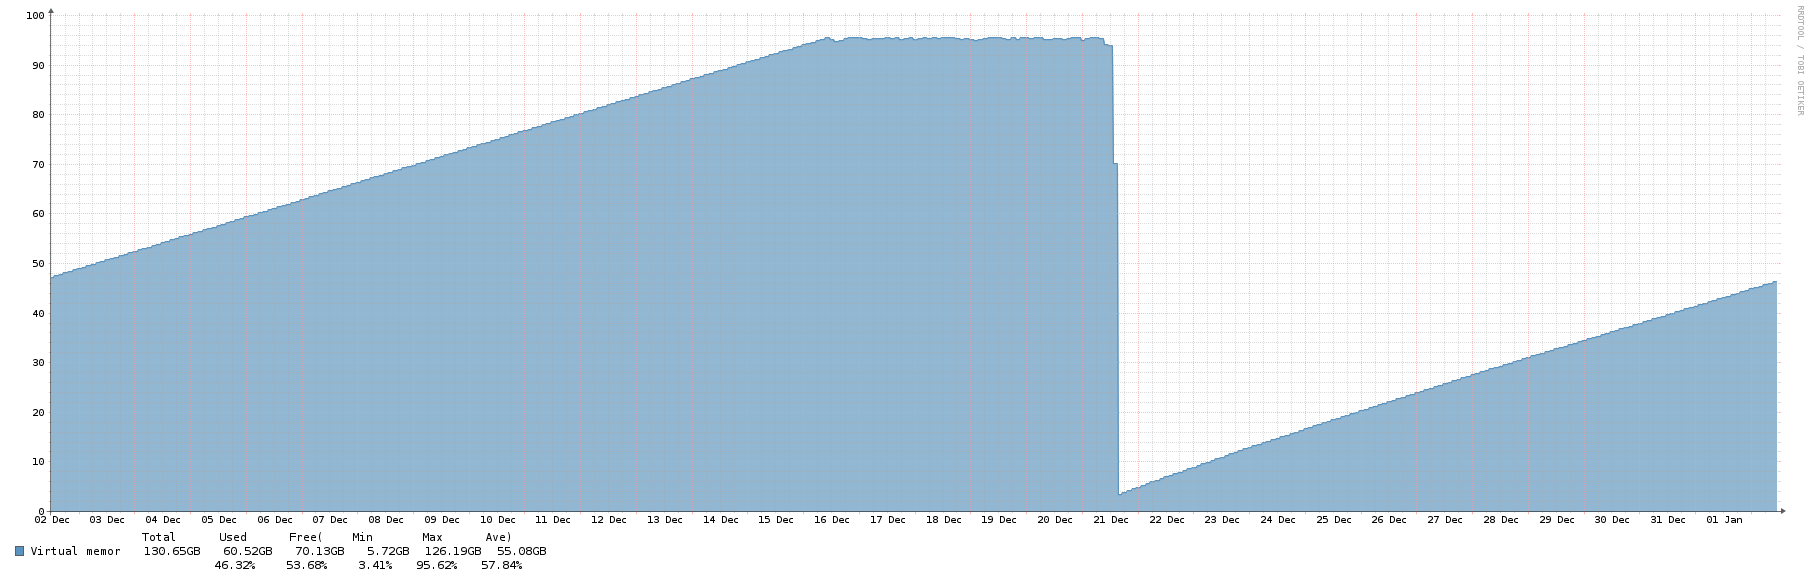
Thanks for the reply. We’ll upgrade to 1.35, but the memory usage is all slabdata used by dentry. Based on what we’ve read on various articles, this especially seems to create this behaviour when there are processes that deal with huge number of files, such as in the millions. Is this the case with librenms? I’ve read that it could be normal, but our system lead is especially worried as we had started to see performance issues once the server was “stuck” in that high range (including having a few BFD hickups) and even a RHEL article confirms that it can reach a point where the performance of the system is impacted:
We can see high dentry_cache usage on the systems those who are running some programs which are opening and closing huge number of files. Sometimes high dentry_cache leads the system to run out of memory in such situations performance gets severly impacted as the system will start using swap space.
I don’t remember reading all of those in the past. Don’t know how long they’ve been there or if I had just missed them, but I’ll definitely be going through all of them tomorrow, thanks.
OK, here’s a current recap. We’ve switched to RRDCached, did some MySQL optimizations and dug a bit more, as it might indeed be nothing to worry about, but we really would like to make sense into all of it and understand what’s happening.
We’ve noticed that we have around 82K new dentry objects after each 5 min cron iteration. Is that considered normal from what you’ve experienced? We’ve never had a system that had that many entries (up to 110G the last time), so we’re really trying to figure what’s causing this. And our installation is still pretty small (see below). If you have a clue, that would be great, otherwise, we’ll keep digging.
After close to 48h after the changes, there really hasn’t been any improvement whatsoever, neither on the IOPS or the dentry object count… Any idea if that can be normal and/or what can I check to validate/improve?
I’m sorry I really don’t know what else suggest I have never seen this on any my servers or with other users with LibreNMS or Network Monitoring in general. I’m not even sure if its a real issue.