Is it possible to create ICMP packet loss alert , let’s say in case there is more than 5% packet loss , notify
try
%macros.packet_loss_5m >= "10"Hi Kelvin,
Right now , I’ve snmp with icmp pool cron every minute, can I somehow in parallel add icmp test in this one minute which will send 3 icmp checks within one minute and messure the packet loss?
I don’t think that’s possible with the poller service.
So in my cron snmp + icmp tests are sent every minute, what the the failure trigger? the alert will be triggered in case it has icmp failure or snmp failure of 1 time? or if it fails one time, it will recheck immediately and then will trigger the alert
try the alert.
you have options, so you are going have to play around and find out what works best you and your environment.
Hi Kelvim,
I used this entity macros.device_down = “2” &&, does it mean that it will check 2 icmp + 2 snmp and if it 2 times fails, it will notify
For packet loss I used %macros.packet_loss_5m >= "10"
Doe it mean if within 5 minutes checks it will be more or equal of 10% packet loss it will notify?
So if within 5 minutes cron is doing 5 checks, it will calculate the total % based on these 5 checks?
No that means the device down check
Device down checks is done based on the cron which is running?or there is nothing to do with the cron
Where I can see what is the rule of this check? such as intervals , etc…
For packet loss I used %macros.packet_loss_5m >= "10"
Doe it mean if within 5 minutes checks it will be more or equal of 10% packet loss it will notify?
So if within 5 minutes cron is doing 5 checks, it will calculate the total % based on these 5 checks?
Checks for packet loss over 5 min time period
Hi Kelvin,
10 Value does it mean 10%? or where I can see the check details? what is this macros specifies
to be honest you need to test this out and find out what works best for you.
But in general, this macros statement is related to some other rule configs? such as intervals , timeouts? where I can see these details?
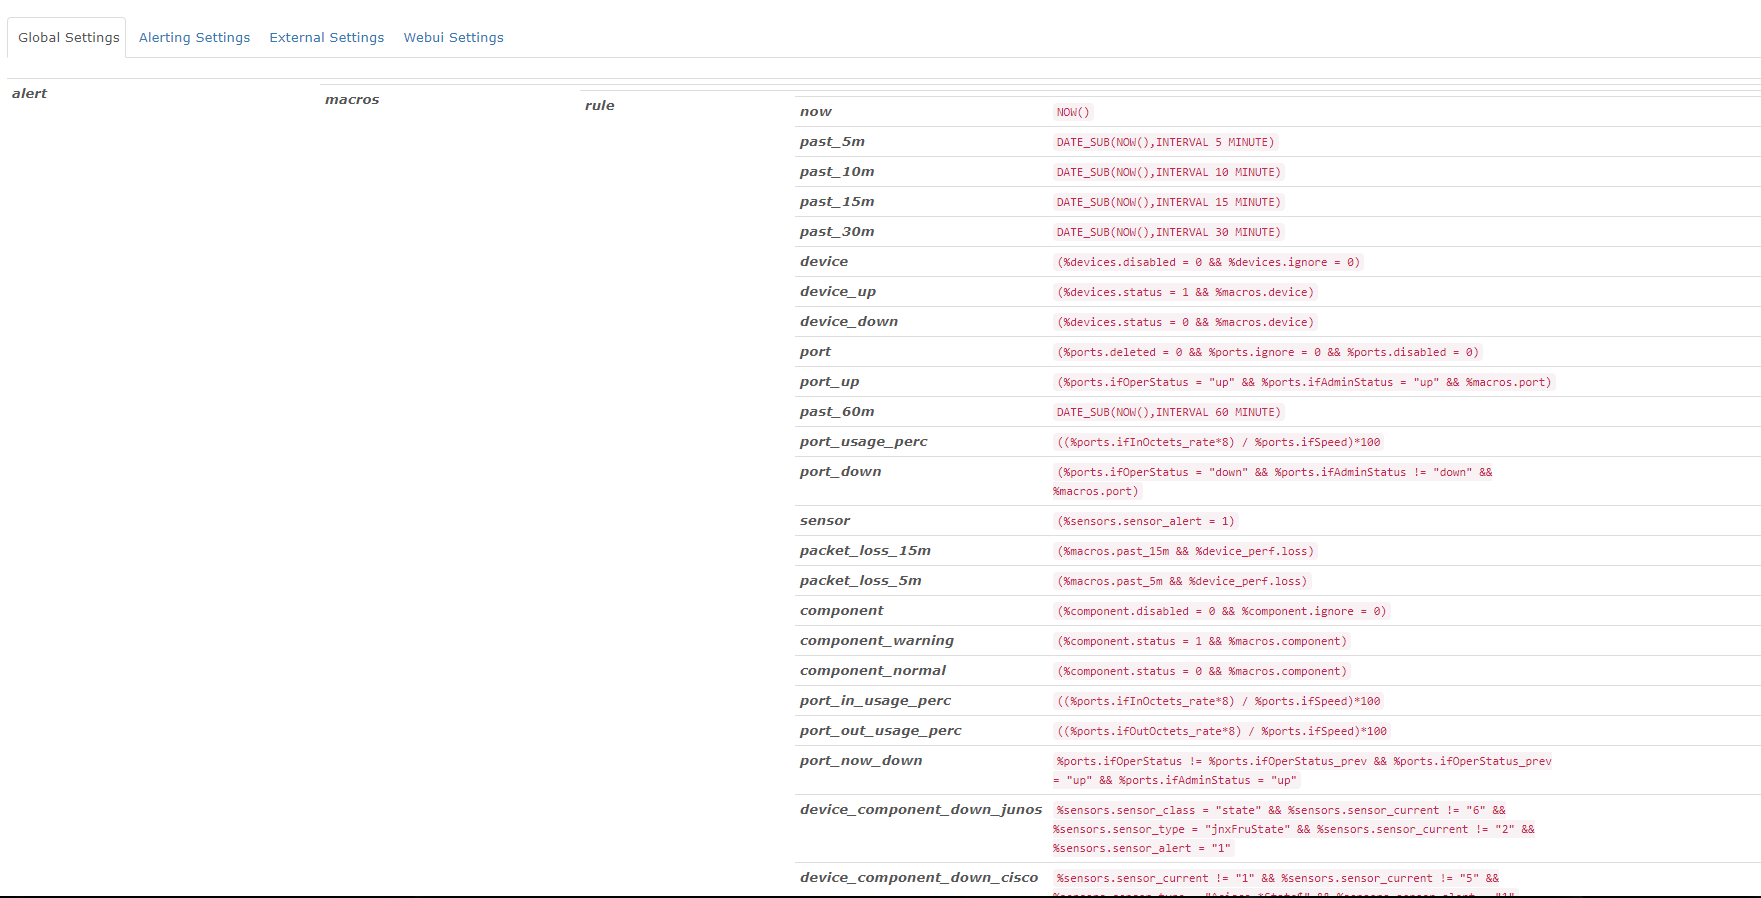
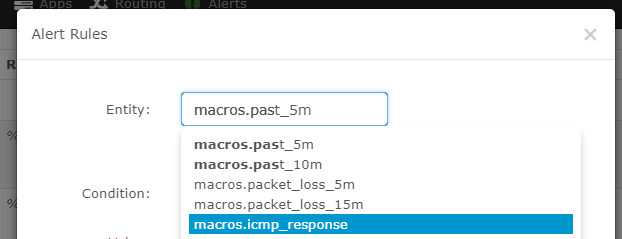
For example, from the gui I see
packet_loss_5m (%macros.past_5m && %device_perf.loss)
Where I can see how many checks it does within 5 minutes? and what kind of check
since you changed your poller settings to 1 m polled every min.
See here -> https://docs.librenms.org/Support/Configuration/#fping
fping
configuration options:
( parameter ): Number of times an attempt at pinging a target will be made, not including the first try.
( parameter ): Amount of time that fping waits for a response to its first request (in milliseconds).
( parameter ): Number of request packets to send to each target.
( parameter ): Time in milliseconds that fping waits between successive packets to an individual target.
You can disable the fping / icmp check that is done for a device to be determined to be up on a global or per device basis. We don’t advice disabling the fping / icmp check unless you know the impact, at worst if you have a large number of devices down then it’s possible that the poller would no longer complete in 5 minutes due to waiting for snmp to timeout.
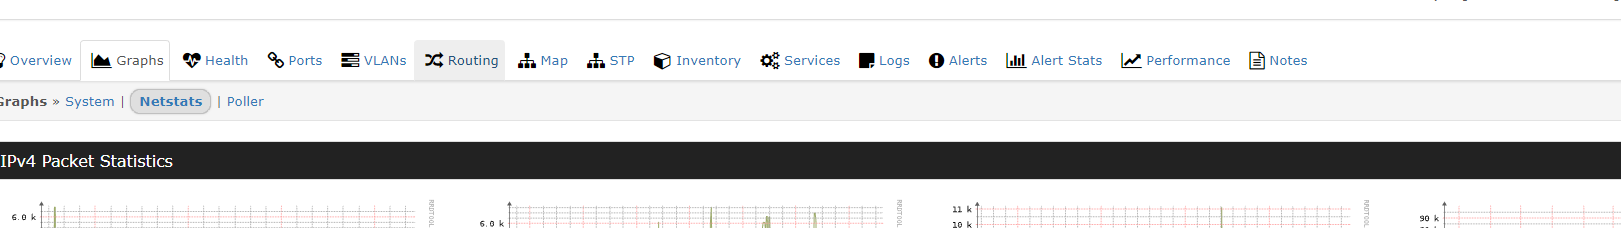
to find it on the device in the web UI go to the device then Graphs → NetStats
Or
In the performance Tab
Hi Kevin,
I changed my pooler setting following this link https://docs.librenms.org/Support/1-Minute-Polling/
I didn’t touch these stuff below:
$config[‘fping’] = “/usr/bin/fping”;
$config[‘fping6’] = “fping6”;
$config[‘fping_options’][‘retries’] = 3;
$config[‘fping_options’][‘timeout’] = 500;
$config[‘fping_options’][‘count’] = 3;
$config[‘fping_options’][‘millisec’] = 200;
I know you did.
Im just showing you where can adjust the ping settings just in case you need them