Incorrect port utilisation alerting with failed SNMP sessions?

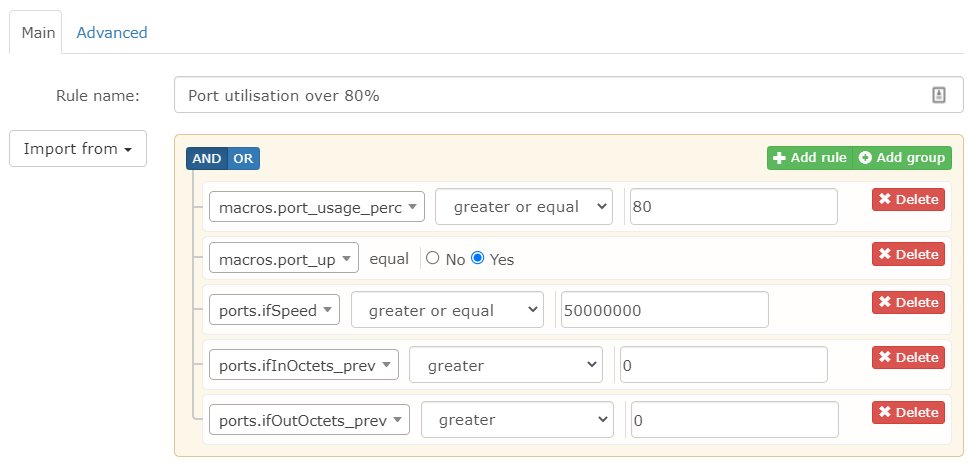
I recently set up ethernet port utilisation alerting for switch ports, and after a bit of tuning of the alert and template it works really well, except for one thing.

We have one switch which from time to time stops responding to SNMP (and web interface) for periods of time around 5-30 seconds so that there are the occasional 5 minute polling periods (a few per day) where LibreNMS is not able to poll SNMP on the device, and then in the following polling period it can again.

This switch frequently sets off bogus port utilisation alerts around the time these failed SNMP sessions occur. Here is an example alert with some amusing values in it:

Device Name: finance
Operating System: D-Link Switch 7.20.003
Hardware: WS6-DGS-1210-24P/G1

High utilisation ports:

#1: Port: Slot0/1
Port Description: D-Link DGS-1210-24P Rev.GX/7.20.003 Port 1
Link Rate: 100 Mbit/s
Receive Rate: 45,027.46 Mbit/s
Transmit Rate: 1,578.57 Mbit/s

#2: Port: Slot0/6
Port Description: D-Link DGS-1210-24P Rev.GX/7.20.003 Port 6
Link Rate: 1,000 Mbit/s
Receive Rate: 13.80 Mbit/s
Transmit Rate: 937.30 Mbit/s

#3: Port: Slot0/10
Port Description: D-Link DGS-1210-24P Rev.GX/7.20.003 Port 10
Link Rate: 100 Mbit/s
Receive Rate: 0.06 Mbit/s
Transmit Rate: 749.00 Mbit/s

#4: Port: Slot0/17
Port Description: D-Link DGS-1210-24P Rev.GX/7.20.003 Port 17
Link Rate: 100 Mbit/s
Receive Rate: 0.00 Mbit/s
Transmit Rate: 748.95 Mbit/s

#5: Port: Slot0/18
Port Description: D-Link DGS-1210-24P Rev.GX/7.20.003 Port 18
Link Rate: 1,000 Mbit/s
Receive Rate: 38.70 Mbit/s
Transmit Rate: 3,319.43 Mbit/s

#6: Port: Slot0/19
Port Description: D-Link DGS-1210-24P Rev.GX/7.20.003 Port 19
Link Rate: 1,000 Mbit/s
Receive Rate: 196.46 Mbit/s
Transmit Rate: 1,480.07 Mbit/s

#7: Port: Slot0/21
Port Description: D-Link DGS-1210-24P Rev.GX/7.20.003 Port 21
Link Rate: 1,000 Mbit/s
Receive Rate: 186.88 Mbit/s
Transmit Rate: 2,398.79 Mbit/s

#8: Port: Slot0/22
Port Description: D-Link DGS-1210-24P Rev.GX/7.20.003 Port 22
Link Rate: 100 Mbit/s
Receive Rate: 10.41 Mbit/s
Transmit Rate: 868.12 Mbit/s

#9: Port: Slot0/24
Port Description: D-Link DGS-1210-24P Rev.GX/7.20.003 Port 24
Link Rate: 100 Mbit/s
Receive Rate: 17.78 Mbit/s
Transmit Rate: 1,071.64 Mbit/s

#10: Port: Slot0/26
Port Description: D-Link DGS-1210-24P Rev.GX/7.20.003 Port 26
Link Rate: 1,000 Mbit/s
Receive Rate: 114.64 Mbit/s
Transmit Rate: 1,270.73 Mbit/s

#11: Port: Slot0/27
Port Description: D-Link DGS-1210-24P Rev.GX/7.20.003 Port 27
Link Rate: 100 Mbit/s
Receive Rate: 9.24 Mbit/s
Transmit Rate: 854.05 Mbit/s

#12: Port: Slot0/28
Port Name: Uplink
Port Description: D-Link DGS-1210-24P Rev.GX/7.20.003 Port 28
Link Rate: 1,000 Mbit/s
Receive Rate: 5,272.77 Mbit/s
Transmit Rate: 45,723.78 Mbit/s

The Link Rates ("ifSpeed") are all correct and the Receive and Transmit rates are pulled from ifInOctets_rate and ifOutOctets_rate in the template and are converted from bytes/sec to Mbit/sec for display.

Many of the figures reported here are ludicrously high so it’s obvious they are bogus and couldn’t even be caused by a network flood.

What seems to be happening is incorrect calculation of ifInOctets_rate and ifOutOctets_rate if the previous polling session failed.

It looks almost as if failing to poll a device logs “0” for the current network interface counters, then on the subsequent successful polling session the valid traffic counters are subtracted from 0 instead of the last known good counters, as a result random, crazy high “rates” are reported for one polling period dependent on the absolute values of the counters.

Obviously in the scenario of a polling session that didn’t succeed the last known good traffic counters should be used instead of zero when subtracting from the current counters, and the increased time period taken into account when calculating the rate. (Eg 10 minutes instead of 5, presumably the time at which each counter is recorded is also recorded so this should be possible)

The traffic graphs themselves seem to handle missed polling sessions gracefully - they just show a small gap. It’s just the calculation of the rate used for alerts which is not handling these polling gaps correctly.

I note that when we had an inadvertent broadcast storm for a few minutes recently (fat fingers on IGMP snooping settings) which caused the majority of our switches to miss responding to an SNMP polling period due to the flood, a relatively high percentage of them also triggered high port utilisation alerts with ludicrously high claimed traffic figures - just the same as this switch does. So the missed polling session does seem to be the cause of the rate calculation error.

Has anyone else noticed false triggering of port utilisation alerts due to missed SNMP polling sessions, and does anyone have a suggestion of a workaround?

Don’t have a solution, but a couple of observations from a while ago.

I often see traffic spikes well out of range when polling is missed - for example when I have devices on remote links which sometimes get too latent for a few minutes. I was able to get that back under control with some rrdtuning and setting the maximum port speeds on devices that had regular issues. Not perfect, but a lot better so may graphs don’t become useless.

Not enabled in that screen, but that section on the device settings.

For alerting of ramping traffic on interfaces that was sometimes false for the above reasons, I set the alerts to delay for 1 polling period or more, so it may be 11 minutes or so until I get an alert, but it would suppress the bogus ones.

I’m also keen to know better ways to manage similar things better if possible.

The main problem is when LibreNMS receives partial data. When this happens, it should probably skip th e whole module, but it doesn’t detect this and just writes the data as it has it.

To completely resolve this, try to get your device to not fail in polling. Firmware update, tune snmp, file bug with vendor, etc.

I don’t think partial data is the case here. It’s happening when the device doesn’t respond to the SNMP query at all during one of the polling sessions. (ICMP destination port unreachable, or just no response at all) It also triggers an SNMP not responding on device alert at the same time.

Unfortunately I can’t do anything to resolve this at the switch side other than replacing it with a different model of switch which is not going to happen any time soon. I’ve been down the whole contact the vendor, update the firmware route already to no avail. It is what it is and my only other option is to just disable SNMP polling of the device, or ignore port utilisation alerts from it.

While the switch sometimes not responding to SNMP is an issue with the switches implementation of SNMP, LibreNMS should be handling this a bit more robustly than than generating bogus traffic rate statistics that set off alerts just because one SNMP session failed. I would classify this as a bug.

In a large complex network there are going to be times when devices don’t respond to SNMP as they should, for example if the network is under attack and some devices limit responses to some query types - if some of the alerts generated in those scenarios are bogus it makes figuring out what happened that much more difficult. When a network is suffering difficulties that is exactly when you want reliable data to quickly diagnose the issue.

If the switch simply doesn’t not respond to snmp, you won’t get false alerts.

I am telling you the only way is if it stops responding during an snmpwalk, and even then it has to be a specific one at specific times. Yes, I think the correct course of action is to throw out the polled data in this case. (Reminder, LibreNMS is a community run project, the only people that work on it are users that volunteer)

I was wondering if it would be possible to add another condition to the traffic utilisation alert - checking that macro.devices_down is false before alerting, but I realised that by the time the 2nd successful poll occurred and the condition was tested the device would be flagged as up again?

Or is there a way in alert conditions to check the state at the previous polling session to see that the previous polling session marked the device as down by SNMP?

Yep, I know the drill. I’ve been a contributor to a number of open source projects over the years, always unpaid and often with lots of users asking for things and reporting bugs. I’ve been on the other side plenty of times…

Unfortunately I can’t follow the LibreNMS codebase to make any meaningful contribution or attempt to fix a bug like this myself.

Just looking at the data from another false alert and I have an idea…

    "ifInUcastPkts": 0,
    "ifInUcastPkts_prev": 0,
    "ifInUcastPkts_delta": 0,
    "ifInUcastPkts_rate": 0,
    "ifOutUcastPkts": 0,
    "ifOutUcastPkts_prev": 0,
    "ifOutUcastPkts_delta": 0,
    "ifOutUcastPkts_rate": 0,
    "ifInErrors": 0,
    "ifInErrors_prev": 0,
    "ifInErrors_delta": 0,
    "ifInErrors_rate": 0,
    "ifOutErrors": 0,
    "ifOutErrors_prev": 0,
    "ifOutErrors_delta": 0,
    "ifOutErrors_rate": 0,
    "ifInOctets": 220003808264,
    "ifInOctets_prev": 0,
    "ifInOctets_delta": 220003808264,
    "ifInOctets_rate": 823984301,
    "ifOutOctets": 1937451858186,
    "ifOutOctets_prev": 0,
    "ifOutOctets_delta": 1937451858186,
    "ifOutOctets_rate": 7256374001,
    "poll_time": 1620657013,
    "poll_prev": 1620656746,
    "poll_period": 267

ifInOctets_prev and ifOutOctets_prev are both zero, (resulting in the delta and therefore rate being ridiculously high…) the likelihood of this happening by chance is extremely low, vs invalid values of zero being logged due to an interrupted SNMP query…

So if I add a logical condition to the bandwidth alert which says do not generate an alert if ifInOctets_prev or (and?) ifOutOctets_prev are zero, this will prevent an alert being generated when the previous traffic (absolute) counters are zero, and this is exceptionally unlikely to falsely prevent an alert as traffic counters of an active switch will almost never poll as zero, especially if I test for both in and out being zero.

Something like this should work?

Hi @DBMandrake ,
Seems that this workaround should help. The best way to find out is to implement both the “original” rule and this new one. And compare. You should get the same “real” results, and should get less “false positive” results.

Ah, good idea - after posting I added the two condition tests I suggested then temporarily set the usage threshold down to 10% to generate some alerts and confirmed that I did still receive alerts with the new tests in place and that the _prev values were non zero for these valid alerts, and thus it should work but I didn’t think of running old and new alert rules side by side to fully confirm it, as the false alerts are very unpredictable, so hard to prove the problem is fixed without running old and new rules side by side as you suggested, so I’ll give that a try.

Would you say that I should be checking both ifInOctets_prev and ifOutOctets_prev are non zero before alerting, as I am now, or only checking one is non zero, or that it doesn’t really matter? When an SNMP session fails in this manner is it likely that both values will be zero?

By coincidence I seem to have an answer to my question already. Another alert on the old rule without the new tests and in this case only one of the _prev values is zero:

    "ifInOctets": 220933827224,
    "ifInOctets_prev": 220928621085,
    "ifInOctets_delta": 5206139,
    "ifInOctets_rate": 22440,
    "ifOutOctets": 1951260041279,
    "ifOutOctets_prev": 0,
    "ifOutOctets_delta": 1951260041279,
    "ifOutOctets_rate": 8410603626,
    "poll_time": 1620674713,
    "poll_prev": 1620674481,
    "poll_period": 232

And looking at the claimed bitrates in the alert itself the in rates look believable while the out rates are definitely not possible.

So it looks like it’s hard to predict what data is valid and what is not if an SNMP polling session times out part way through, so I am probably best to check that both values are greater than zero as I already am, as it’s apparently possible for only one to be invalid.

It’s a shame that partially completed SNMP sessions which time out still cause partial data to be logged, I wonder what other effects it could have on statistics besides triggering invalid port utilisation alerts.

This topic was automatically closed 91 days after the last reply. New replies are no longer allowed.