Hi,
Please read through these two threads, I suspect you are having the same issue - occasional partial failure of SNMP polling from the affected devices causing 0 bytes to be stored in the interface counters.
On subsequent polling with a proper value this will look like an enormous traffic spike for one polling session. I encountered it when testing port traffic utilisation alerts and actually had to add a workaround in my alert rules otherwise I’d get at least one or two per day.
One way to detect this would be to set up a high traffic utilisation alert and put the byte counters in your template so you can see the exact byte counters when the alert sets.
Include these variables in your alert template and they will help you pinpoint whether this is your issue or not:
ifInOctets
ifInOctets_prev
ifInOctets_delta
ifInOctets_rate
ifOutOctets
ifOutOctets_prev
ifOutOctets_delta
ifOutOctets_rate
Most likely you will see an ifInOctets_prev or ifOutOctets_prev value of 0 when the alert happens.
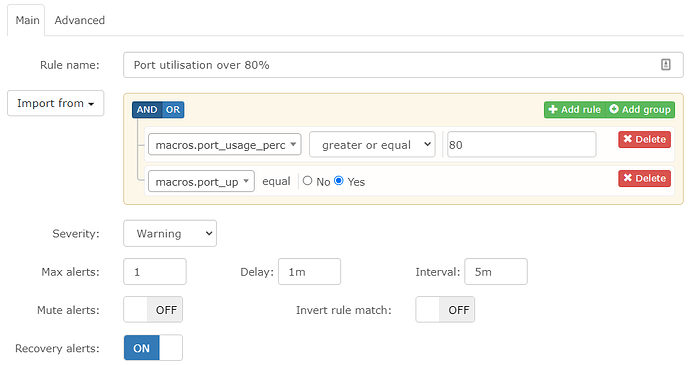
Here is an example of an alert you could use:
This will trigger when a port is over 80% utilisation. You could try increasing the comparison to check for >= 100 which should never normally occur but it should still trigger when you see your abnormal spikes.
If you find that this is indeed your issue then it is caused by the SNMP polling session to your device hanging, timing out or disconnecting part way through. If this happens at just the right place it can cause incorrect data to be saved.
