Hi!
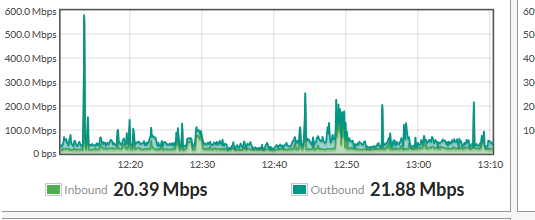
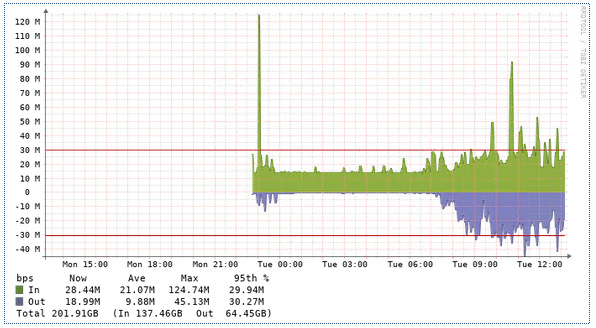
I am having issue with interface bandwidth graph. This is my FortiGate interface traffic. Its showing before 12 that the traffic hit high at 600M but in the second picture which is LibreNMS graph doesnt show that value. It looks like the graph are not consistent.
How can I correct this on Librenms side?
Thanks for looking.
Your Fortigate graph is likely using a realtime counter and might not even be using snmp, so it will preserve the real peak as it has direct access to the stats.
LibreNMS is taking the information from SNMP which polls the device every 5 minutes and draws the traffic in that 5 minutes, so the peak will be lower for short spiked traffic, but the traffic usage is still correct.
You can change LibreNMS to 1 minute polling https://docs.librenms.org/Support/1-Minute-Polling/ to get more granular view of peaks (be cautious of the side affects of doing so) , or use 1:1 netflow sampling and use nfsen integration with LibreNMS https://docs.librenms.org/Extensions/NFSen/
Thanks Chas. I will check your links.
Stupid question but I am asking :).
Even if its using 5 min poll but it should appear after 5 mins of the graph. I mean let say it happens on 12 on real time on Fortigate. Then Librenms poll at 12:05 then ther MAX value should appear?
Yes at 12:05 then you would expect LibreNMS to show a larger spike in traffic, but it won’t be the same as your fortigate graph. Your spike will be flattened out over the 5 minutes.
in /opt/librenms you can run ./poller.php -h <fortigateIP> -d -r -f -m ports
you will see all the information LibreNMS gathers in a poll, you will see somewhere the SNMP counter IN/OUT for each interface like this;
ifHCInOctets.31 = 25922400
then in 5 minutes that counter might go up
ifHCInOctets.31 = 25925550
When you see the graph it will draw the difference of that counter over the 2 polls (5 minutes)
By increasing the interval of SNMP to 1 minute, you will gain more counter updates, so the spike will be less flattened out , and should be closer to your fortigate graph, however a lot of devices can’t even reply to SNMP within 1 minute, especially if you have many interfaces, so you will want to monitor closely if you decide to change.
I’m guessing this should be solved in the future when streaming telemetry is the new standard instead of SNMP, but i’ts not widely used, and not embedded in many devices yet. you can read up here on how Cisco have done it in IOS-XE https://developer.cisco.com/docs/ios-xe/#!streaming-telemetry-quick-start-guide. (telemetry not supported by librenms just yet, but a good read)
Thanks Chas for the explanation.
I used Cacti in my previous job and I configured it in 2015/2016 and we were using Cisco Firewall and Switches. I was getting kind of correct traffic in a way that we had 100MB connection and I was able to see 98MB or even 100MB graph lines and it was set to 5 mins poll in Cacti. Right now I am working with Fortigate and Dlink and I configured Cacti and was not seeing the expected output. So I moved to Librenms to test it out.
May be Cisco in past was doing in different way.that at that time I was able to see the high usage of interface in the graph. Right now both Fortigate and Dlink doesnt show traffic above 110 + :).
I even trigged IPerf to generate high traffic.
I read that 1 min will create lots of graph and also it may interfer with hardware performance and spike the cpu or memory as its doing polling quite often.
The reason to see high speed interface utilization is that some time user complain about slow internet etc and graph can tell that the interface was almost 99 utilized.
Is it possible to just run the separate poller for few interfaces to give me Max values?
All I want is that I can see if forexample at 12:00 I have 98% bandwidth utilization and also an alert to tell us that we are on peak of our interface.
Thanks
I don’t think so and your RRD graph is also tuned to draw 5 minute intervals, which has to match the poller.
You can see my similar question answered here 1 minute and 5 minute polling on the same server