Hi. I’ve recently created various Dashboards in LibreNMS and many of them show “physical memory” usage near 100%, where the physical machine has nowhere near that type of memory usage.
I’ve reviewed various links and items where this has been discussed in relation to LibreNMS, in Github:
I personally believe the LibreNMS memory graphs for Linux are wrong and I’ll explain why. Note, I’m not trying to start a debate here, I just want to highlight practicality and why LibreNMS should have this fixed.
Generally speaking, the purpose of a monitoring solution is to alert an admin on problems that need attention. As admins, we typically set thresholds of 80% usage, 90% usage etc and get notifications in various transports, which alert us of things which need attention.
In the case of “memory usage” in Linux, I’m getting 100% usage for many of the Linux servers when in fact they are much less. So in essence, these particular checks and graphs are useless, since they don’t give a real world indication of memory usage and / or memory free on the real Linux server.
So in essence, I don’t agree with people in Github (like @paulgear) for a server monitoring solution, since (again generally speaking) the primary purpose admins would use a server monitoring solution is not to see pretty graphs, but be notified when things need attention. The pretty graphs, IMHO, comes second to that.
We also employ other monitoring solutions (like OMDlabs / Nagios) which give the real memory usage and notify correctly, but my comments here are for LibreNMS, making this product better and useful is the reason I’m posting here.
Hi Kevin. You’re assuming here I’m a coder, I’m not. I’m a sys admin with experience in bash, some perl, etc. I have no idea what LibreNMS is programmed in and how the internals work, how can I possibly code for it?
I’m saying you don’t have to be a programmer to help. I’m asking you to offer a solution instead of just talk. Allot of us here are not “programmers” but are passionate about Librenms and help volunteer time and code.
All I have heard so far is talk about a possible issue but no solution and an excuse of “I’m a sys admin can’t help.”
And most importantly, @micoots, we should remember that snmp is providing LibreNMS the values. So if you don’t like the values you see, you need to ask the Kernel and SNMP to provide better value, not the LibreNMS team at all…
Again, @micoots if the “available” value is not provided by SNMP, there is nothing really we can do in an SNMP monitoring tool
You can have a look here for a quick description of the OID : http://www.debianadmin.com/linux-snmp-oids-for-cpumemory-and-disk-statistics.html
Then if you want some other value, as @Kevin_Krumm said, we are all network engineers, sysadmin, etc, and none of us, to my knowledge, are developpers of the SNMP linux implementation, nor the kernel memory implementation. We have no other choice than using the available values there.
I can understand you expect another answer, but you have to understand there is no other answer you can get from a community driven project. I am just like you, a LibreNMS user, not a dev, doing this on my free time, helping as much as I can. And I cannot rewrite the linux kernel and the snmpd server right now …
OK thanks for the reference. I see in that link we have:
Memory Statistics
Total Swap Size: .1.3.6.1.4.1.2021.4.3.0
Available Swap Space: .1.3.6.1.4.1.2021.4.4.0
Total RAM in machine: .1.3.6.1.4.1.2021.4.5.0
Total RAM used: .1.3.6.1.4.1.2021.4.6.0
Total RAM Free: .1.3.6.1.4.1.2021.4.11.0
Total RAM Shared: .1.3.6.1.4.1.2021.4.13.0
Total RAM Buffered: .1.3.6.1.4.1.2021.4.14.0
Total Cached Memory: .1.3.6.1.4.1.2021.4.15.0
memTotalFree:
The total amount of memory free or available for use on this host. This value typically covers both real memory and swap space or virtual memory.
So this cannot be used in a “physical” metric, cause it includes both physical and virtual.
The value we use now is exactly the one that provide the expected value for a physical metric.
memAvailReal:
The amount of real/physical memory currently unused or available.
So there is nothing that we can change for a “physical memory” metric.
The tool is open source, you can easily change the OID that is polled. But according to the doc, it makes no sense cause totalFree (physical + swap) can be superior to totalReal (physical). You could have more totalFree memory than the total of physical memory (totalReal). Most probably true just after booting the host, I suppose. I don’t know what you could conclude out of if.
To solve this problem, I modified the file:
/opt/librenms/includes/polling/ucd-mib-inc.php and added the line
$memTotalReal = $memTotalReal + $memShared + $memBuffer; on line 142, just before the
$fields = array(
line.
It’s probably a matter of Librenms not reporting the stats that are useful to you. If you’re monitoring Linux systems, that are doing any kind of file service, you’re going to see high memory utilization due to buffer cache. It will use all available memory for buffer cache. This isn’t bad - it makes file access fast and if the system needs it for a process’s working set it will just reclaim it.
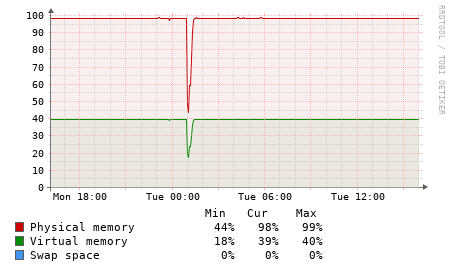
So this graph, above, shows that all the memory is in use… that’s not unexpected since this is a NAS device.
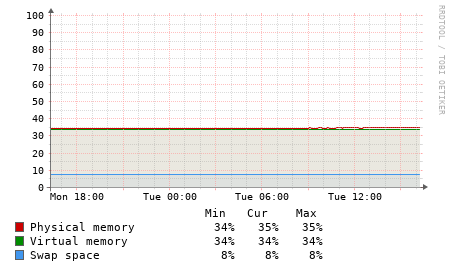
This graph shows that there is plenty of memory free, because this system doesn’t do much file access.
What tool on your system is returning different memory numbers from what SNMP delivers?
As a Sr Sys Admin and Architect I’ve found LibreNMS RAM/memory tracking (as in, non-permanent storage) to be not actually useful as it misrepresents the situation.
The majority of the systems I monitor are VMs, but I also monitor virtual hosts.
First, “Physical Memory”. The naming of this metric is completely useless. All memory is physical, even if it’s virtual, it corresponds to memory used in RAM DIMMs. So this really should be renamed to something far more self-evident as to what this is.
Second, Physical Memory, is almost always 100% used on every system I have. This completely misrepresents what’s going on, as the monitoring appears to combine Linux cache usage with actual application RAM usage. Linux kernel behaviour is that is tends to use less cache as apps use more RAM, and/or push data into swap. This needs to be far more clearly spelled out.
Third, “Virtual Memory” also needs to be renamed to something actually self-evident of what this means. Remember, LibreNMS is designed to be OS agnostics of what it monitors. Furhtermore, this value seems to combine actual total RAM capacity with swap capacity, which is completely useless since we also track swap in LibreNMS. I want to see here the actual RAM usage that applications use, because that’s what really impacts my environment. I have a node that actually has only 32GB of RAM installed, yet this metric reports it as 64GB capacity, and using 32GB of that, because it combines the swap with RAM, and also combines the app RAM usage with the Linux kernel cache, 100% misrepresenting the actual memory usage here.
I know that people have asked in this thread for what the real solution is in each case, and I don’t know what metric accurately represents that from one to the next. But as it sits, this behaviour completely defeats the point of having LibreNMS to monitor memory usage. The stats are useless, inaccurate and misleading. Can we please finally get this added as a priority to the development pipeline already? It’s been like this for years.
Should we advocate for a change to net-snmpd upstream then too? So this can get fixed comprehensively for all of humanity?
Thanks for your contributions @appleseed ! Out of curiosity (can’t read them this very moment), do your changes fall in-line with what I’m proposing, or did you discover a better way to do it than that? I’m curious!
Partially - it will "fix“ the memory “almost always 100%” as the OID of “Available Memory”, which is mostly what people will be interested in when they type in free or such, support was added to net-snmp in the first patch mentioned above and it’s checked in, but release date is not confirmed yet.
the second WIP PR is adding ability for LibreNMS to read and show the “Available Memory” so it won’t be always showing 100% unless the Available Memory on your system is really low.
Regarding the Virtual Memory, reading the snmp response, I think this is how snmp agent reports and LibreNMS just displays what it gets as is, please correct if I were wrong.