Hello all!
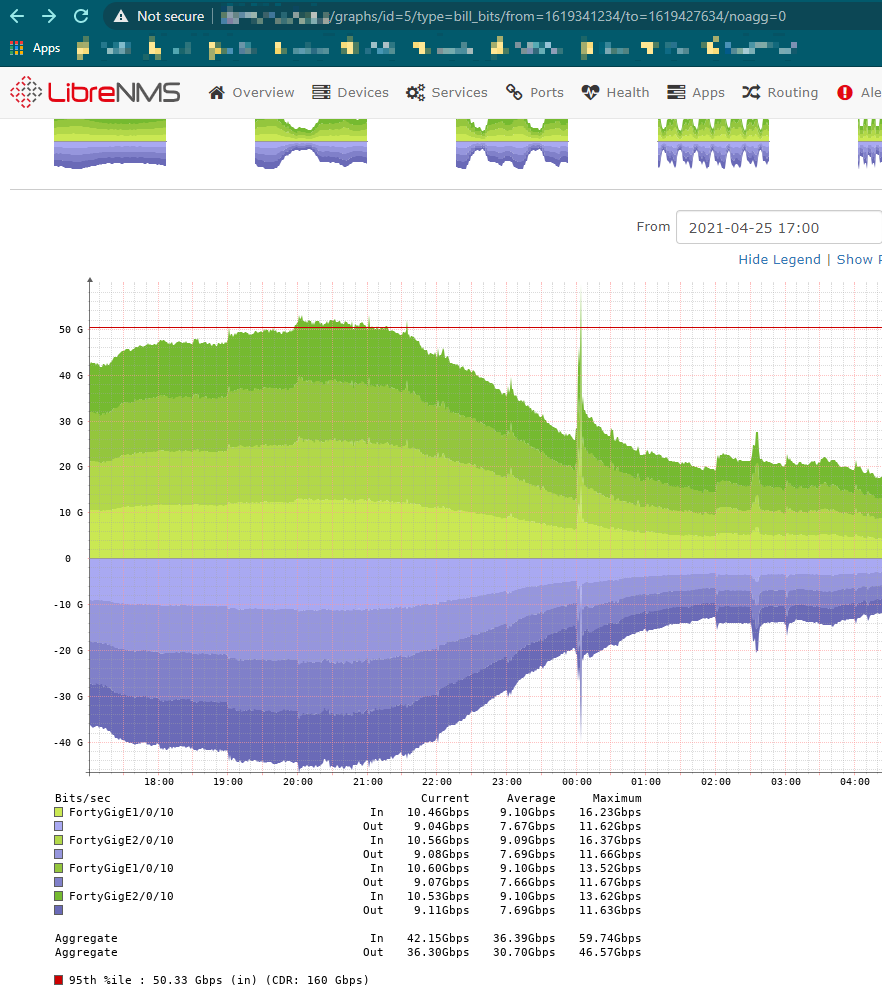
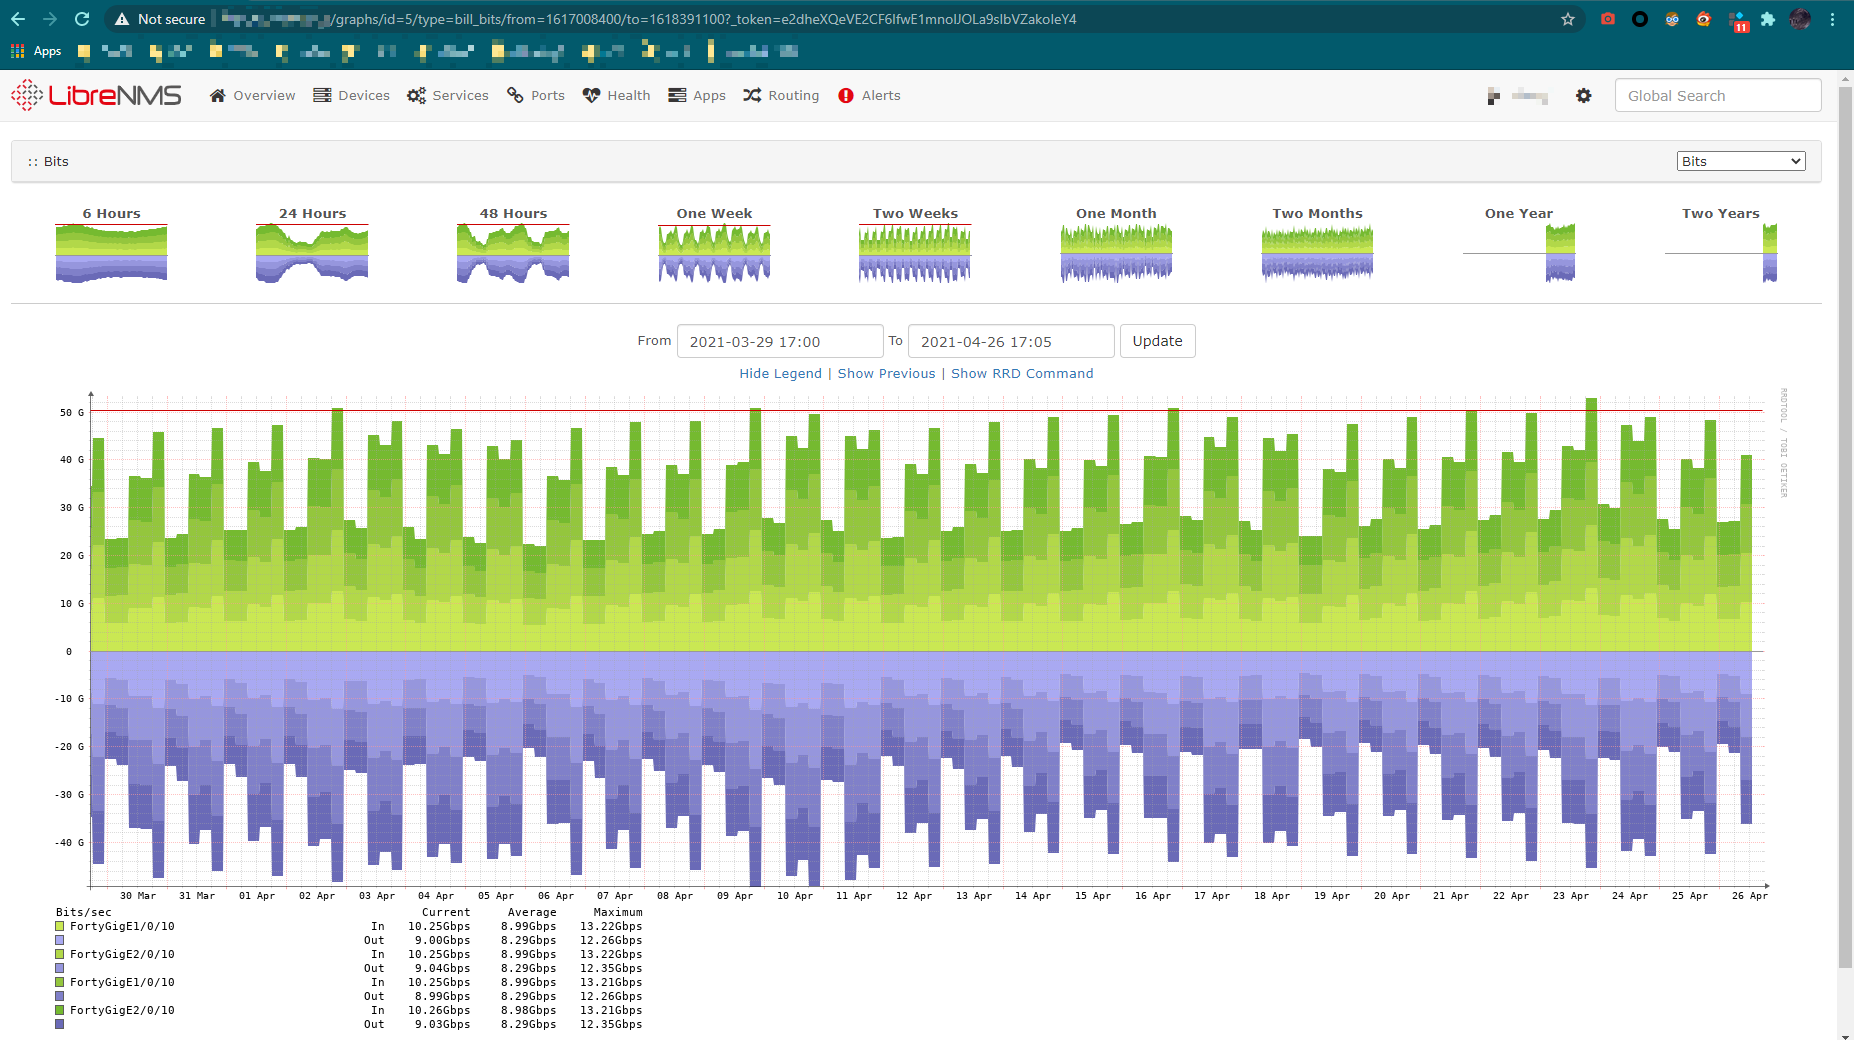
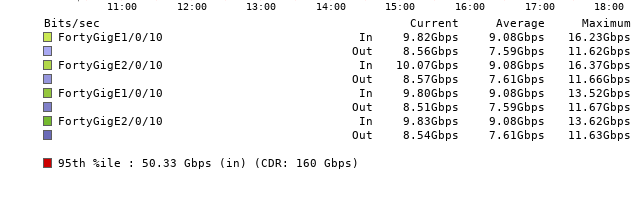
The current graphs does not visualize the peak traffic on all ports and would like to add the total max in/out data to the graphs.
1 Like
from the code side, I think it needs some bad data fixing for that function on multiple ports Aggregating bandwith graphs from interfaces on seperate devices?
then noagg added to bill_bits (nototals is working)
and then create an option in the GUI to append noagg and nototals to print graph rows for multi ports/bill ports etc.
Thanks for reply!
I will read this issue for finish this, thanks for providing ideas!