New librenms python poller service is underperforming badly for some devices

====================================

Component Version
LibreNMS 1.41-6-g3269183
DB Schema 253
PHP 7.2.1
MySQL 10.2.12-MariaDB
RRDTool 1.6.0
SNMP NET-SNMP 5.7.2
====================================

[OK] Composer Version: 1.6.5
[OK] Dependencies up-to-date.
[OK] Database connection successful
[OK] Database schema correct
[FAIL] You have no timezone set for php.
[FIX] PHP: Runtime Configuration - Manual
[WARN] Some devices have not been polled in the last 5 minutes. You may have performance issues.
[FIX] Check your poll log and see: Performance - LibreNMS Docs
Devices:
[ a lot of devices…]
and 16 more…
[FAIL] Some devices have not completed their polling run in 5 minutes, this will create gaps in data.
[FIX] Check your poll log and see: Performance - LibreNMS Docs
Devices:
[more devices…]

==========================================

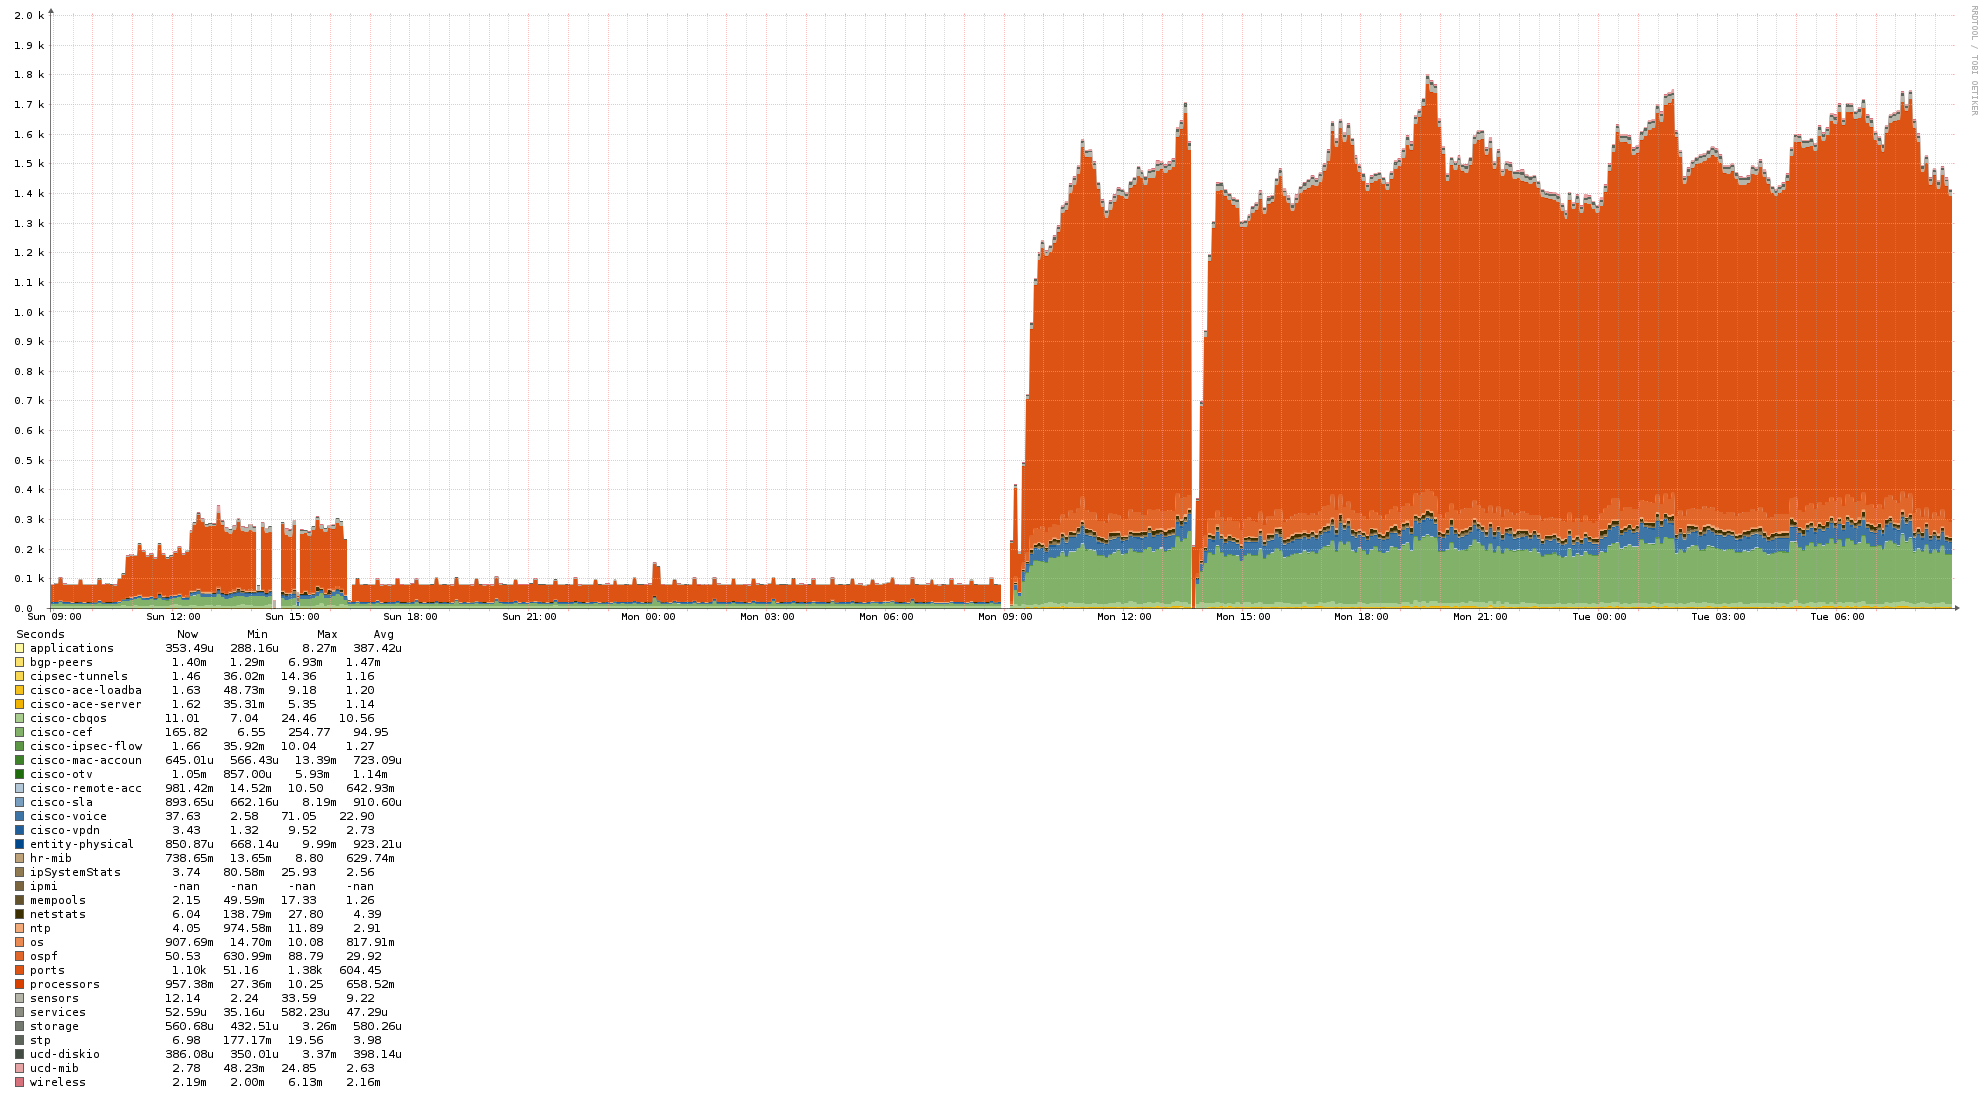
We migrated recently from the ‘old’ librems service to a new one. Polling for certain devices is super slow now, which was not a problem with old service - or even cron-based poller.

It looks like mostly Cisco Nexus devices are affected, but this could be because they have got the most interfaces/items to poll.

Some stats from the UI:

Service config:

$config[‘service_poller_workers’] = 64;
$config[‘service_services_workers’] = 8;
$config[‘service_discovery_workers’] = 16;
$config[‘service_poller_frequency’] = 60;
$config[‘service_services_frequency’] = 60;
$config[‘service_discovery_frequency’] = 21600;
$config[‘service_billing_frequency’] = 300;
$config[‘service_billing_calculate_frequency’] = 60;
$config[‘service_poller_down_retry’] = 30;
$config[‘service_loglevel’] = ‘DEBUG’;
$config[‘service_update_frequency’] = 864000000;

No errors or obvious problematic messages in service logs.

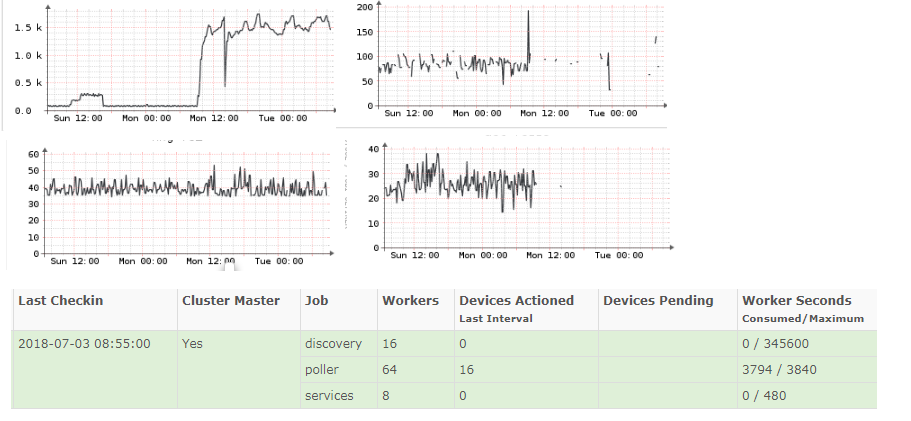
There are 106 devices in total, no distributed polling. We set new poller service with the same amount of threads (64) as the old one. 1 minute polling interval is what we use.

BTW, the service runs scl flavour on Centos 7, with Python 3.6 software collection package.

I’m running this with Nexus devices and have zero noticeable issues.

Have you looked at the graphs for the local poller to see if it’s struggling on disk io or anything?

Isn’t your graph showing that you were never completing polling in < 60 seconds before?

There are a few devices that took a bit longer than 60 seconds to poll in some cases with the previous service, but this was fine - we were just getting occasionally gaps in the graphs. Now polling pretty much never finishes for some of the stuff.

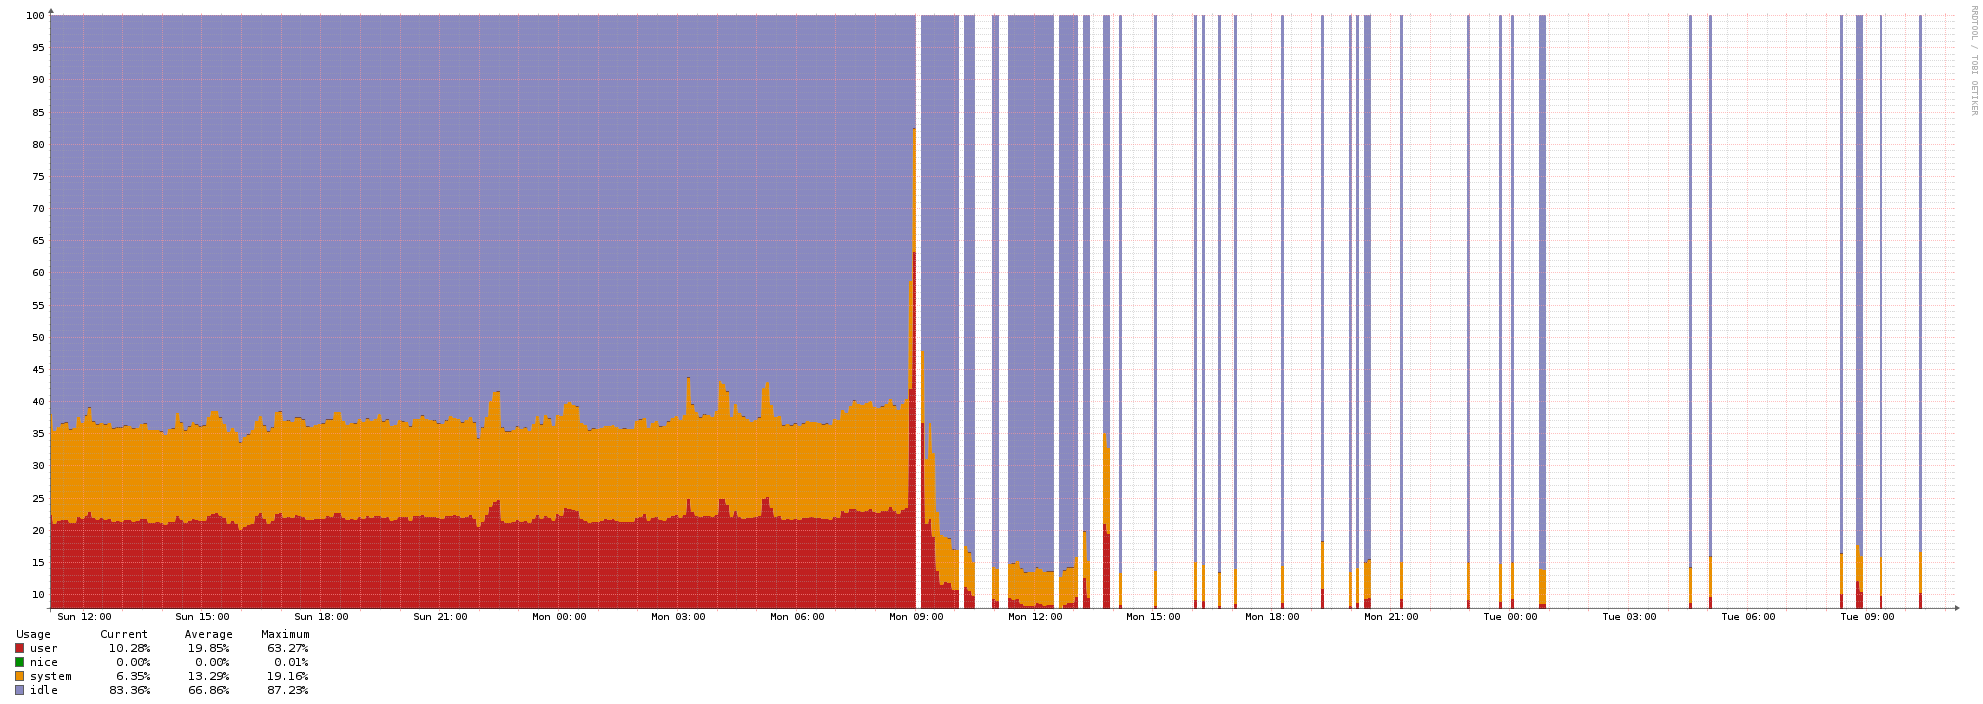
The load on the poller looks fine, no I/O wait (it is all sitting on SSDs anyway).

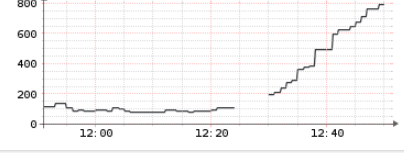
The CPU on the poller usage after migration to new service is much lower actually, at least from the snippets of data it shows (it struggles even with polling itself):

It looks like something is blocking/throttling/stalling the workers - so they are doing much less work (at least in certain scenarios) than in case of previous setup.

Check your standard OS logs to see what might be happening with the poller during that time.

There is not too much going on in the OS logs I am afraid, the poller logs reports as follows:

Jul 5 08:07:08 pollersrv01 scl[7433]: pollersrv01(DEBUG):Posted work for 138 to poller:0 queue size: 32
Jul 5 08:07:08 pollersrv01 scl[7433]: pollersrv01(DEBUG):Posted work for 49 to poller:0 queue size: 33
Jul 5 08:07:08 pollersrv01 scl[7433]: pollersrv01(DEBUG):Posted work for 29 to poller:0 queue size: 34
Jul 5 08:07:08 pollersrv01 scl[7433]: pollersrv01(DEBUG):Posted work for 4 to poller:0 queue size: 35
Jul 5 08:07:08 pollersrv01 scl[7433]: pollersrv01(DEBUG):Posted work for 70 to poller:0 queue size: 36
Jul 5 08:07:08 pollersrv01 scl[7433]: pollersrv01(DEBUG):Posted work for 114 to poller:0 queue size: 37
Jul 5 08:07:08 pollersrv01 scl[7433]: pollersrv01(DEBUG):Posted work for 86 to poller:0 queue size: 38
Jul 5 08:07:08 pollersrv01 scl[7433]: pollersrv01(DEBUG):Posted work for 19 to poller:0 queue size: 39
Jul 5 08:07:08 pollersrv01 scl[7433]: Poller_0-51(DEBUG):Queues: {‘poller:0’: <multiprocessing.queues.Queue object at 0x7fba203313c8>}
Jul 5 08:07:08 pollersrv01 scl[7433]: pollersrv01(DEBUG):Posted work for 64 to poller:0 queue size: 40
Jul 5 08:07:08 pollersrv01 scl[7433]: Poller_0-51(INFO):Polling device 10
Jul 5 08:07:08 pollersrv01 scl[7433]: Poller_0-59(INFO):Polling complete 58
Jul 5 08:07:08 pollersrv01 scl[7433]: Poller_0-59(DEBUG):Queues: {‘poller:0’: <multiprocessing.queues.Queue object at 0x7fba203313c8>}
Jul 5 08:07:08 pollersrv01 scl[7433]: Poller_0-59(INFO):Polling device 13
Jul 5 08:07:10 pollersrv01 scl[7433]: Poller_0-43(INFO):Polling complete 133
Jul 5 08:07:10 pollersrv01 scl[7433]: Poller_0-43(DEBUG):Queues: {‘poller:0’: <multiprocessing.queues.Queue object at 0x7fba203313c8>}
Jul 5 08:07:10 pollersrv01 scl[7433]: Poller_0-43(INFO):Polling device 12
Jul 5 08:07:10 pollersrv01 scl[7433]: Poller_0-42(INFO):Polling complete 97

Is there any fundamental difference between how old vs new service operate that could compromise the performance in a way we are seeing?

Possibly we can enable some additional debugging to better understand what is going on here?

Looks like the queue is getting backed up. The work is done by poller.php and that should take the same amount of time.

I wonder if something isn’t working with your lower poll frequency.

Does switching back fix it?

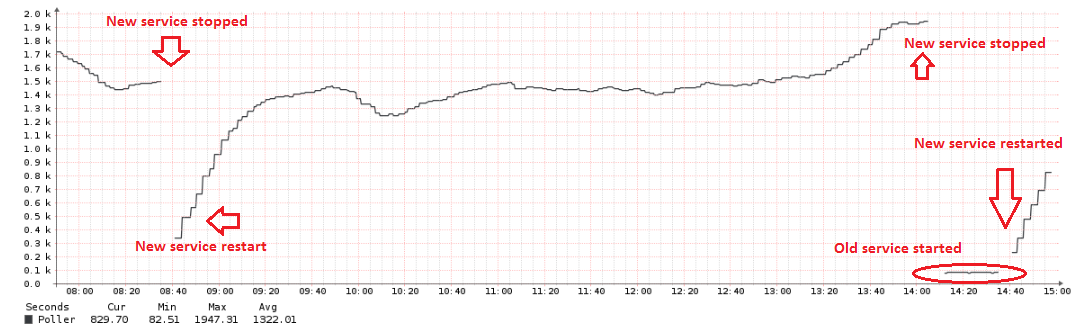
Thanks for checking, I can confirm that switching back to librenms-poller-service instantly fixes the problem (literally just by stopping librenms.service and restarting librenms-poller-service.service):

Is there any additional debug information we can try to capture to troubleshoot this further?

Just to confirm, it looks like performance of this new poller service degrades over time, polling times are getting slower and slower:

The old one exhibits consistently good performance.

Possibly the new service handles devices that exceed configured polling period in a different way (some stale or incomplete threads/ jobs keep accumulating slowing everything down?)

I think murrant meant changing to 300 seconds for poller frequency fix it?

No I meant using the old service. Switching to 300s for poller sounds like a pain. Although it would be interesting to know if it has any effect.

Just to let you know, I have just tried the new librenms.service again (was using legacy one due to these problems) with the latest and greatest version 1.52, but unfortunately the issue still persists:

image

However, it looks like the only devices affected by this at the moment are Nexus 5K, the polling graphs for other stuff look fine - have you got any idea what could it be?

More detailed polling graph from affected 5K:

Are you using this? https://docs.librenms.org/Extensions/Dispatcher-Service/

Correct, this is the guy I have problem with (librenms-service.py)

The old service (poller-service.py) however works fine on the same box with the same setup

It really looks like only Nexus 5K devices are affected by this problem with new service at the moment - but the impact is rather dramatic. The only ‘special’ think about them I can think of is that they have got a lot of ports (more than our other network kit, generally), but it does not make sense still…

Considering they all just call poller.php the poller process should take the same time for all.

Are you using selective port polling?

Adding just another image of poller performance sample across the board:

I had to remove hostnames, as they are rather sensitive, but marked Nexus 5Ks where applicable.

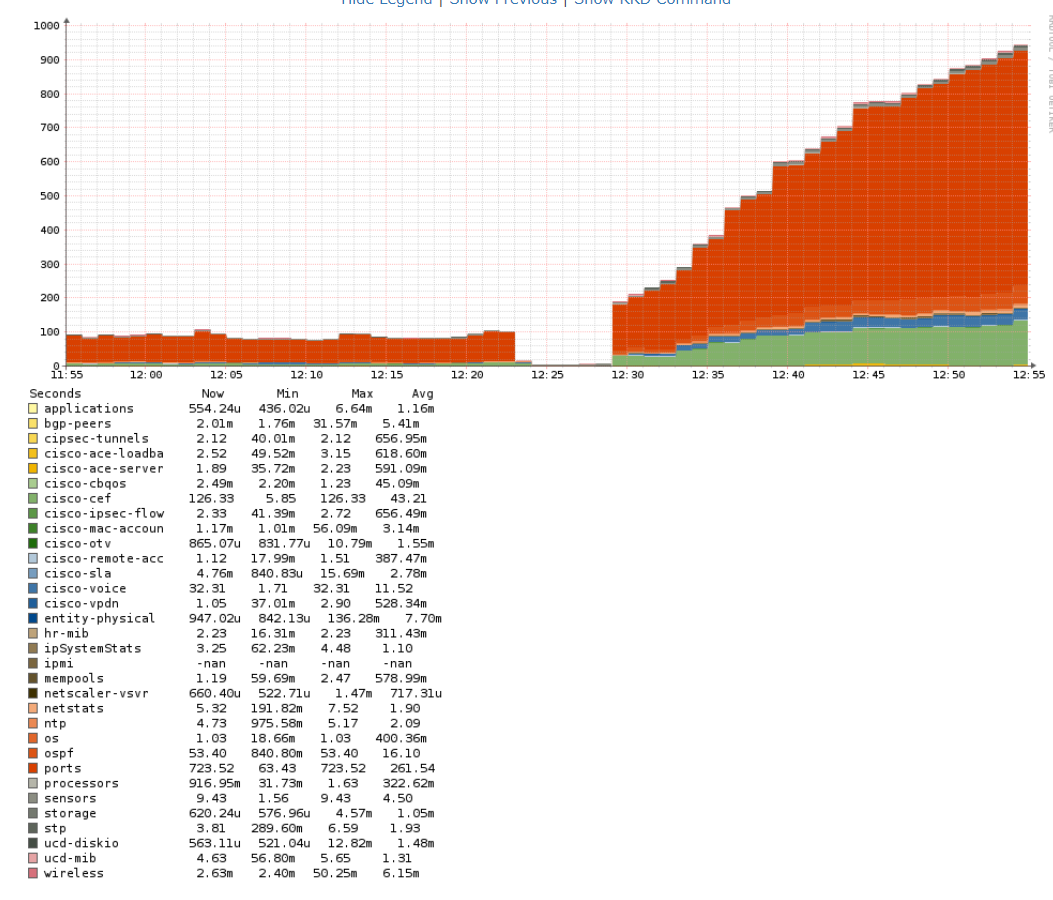
This new librenms-service.py service was active from around 12:00 to 16:00 - I reverted to old service at that point.

It looks like new service generally perform a bit better than old one across the board, except for these Nexus 5K devices (we have got 4 in total), where polling is simply catastrophically broken for some reason…

No We have a totally new service are you are talking about… from back in 2018?

See here https://docs.librenms.org/Extensions/Dispatcher-Service/

Yes, this is the new guy I am using and have problem with - librenms-service.py AKA Dispatcher Service. Not using selective interface polling.

I had a quick look and compared commands triggered by these services, the new one seems to be stuck in Nexus case here:

/usr/bin/snmpbulkwalk -Cr30 -v2c -c -OQUs -m IF-MIB -M /opt/librenms/mibs:/opt/librenms/mibs/cisco -t 10 udp:nexus-hostname:161 ifXEntry

What is worse, it seems to be spawning more and more of these ifXEntry guys over time, even when one does not finish in time.

systemctl status librenms.service | grep nexus-hostname

       ├─12212 /usr/bin/snmpbulkwalk -Cr30 -v2c -c          -OQUs -m IF-MIB -M /opt/librenms/mibs:/opt/librenms/mibs/cisco -t 10 udp:nexus-hostname:161 ifXEntry
       ├─20021 /usr/bin/snmpbulkwalk -Cr30 -v2c -c          -OQUs -m IF-MIB -M /opt/librenms/mibs:/opt/librenms/mibs/cisco -t 10 udp:nexus-hostname:161 ifXEntry

The old service also seem to spend a lot of time in ifXEntry, but in this case the process actually finishes within 30 seconds or so (or maybe old service script just kills it if it takes too long??)

systemctl status librenms-poller-service.service | grep nexus-hostname

       ├─12665 /usr/bin/snmpbulkwalk -Cr30 -v2c -c          -OQUs -m IF-MIB -M /opt/librenms/mibs:/opt/librenms/mibs/cisco -t 10 udp:nexus-hostname:161 ifXEntry

BTW: this is all with 60 second polling