Hi Guys,
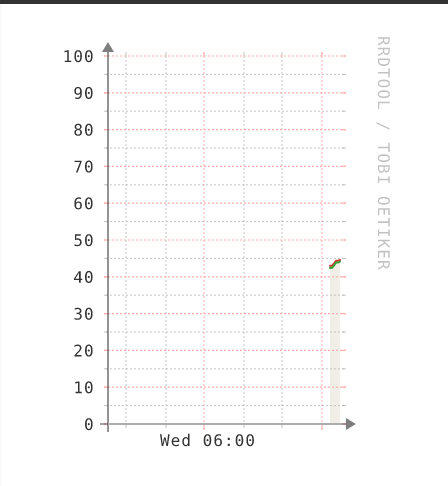
Had one server without a graph for CPU because other servers does have graph output I thought delete and add it again. Now my problem is that I do not get CPU, Memory, overall Traffic and Storage.
Could someone help me ?
Validate:
| Component |
Version |
| LibreNMS |
5e32474d26cc30c44bad82fc3e926c0183e8e020 |
| DB Schema |
196 |
| PHP |
7.0.18-0ubuntu0.16.04.1 |
| MySQL |
10.0.29-MariaDB-0ubuntu0.16.04.1 |
| RRDTool |
1.5.5 |
| SNMP |
NET-SNMP 5.7.3 |
==========================================================
[OK] Database connection successful
[OK] Database schema correct
Output Poller:
https://p.libren.ms/view/1064c7f3
Output SNMP:
https://p.libren.ms/view/12bee9cb
How long are you waiting for the groups? most cases you need to wait 10-20 min for graphs to populate.
Also, can you Pastebin the discovery output.
Hi Kevin,
I’m waiting for more than 30 minutes now I guess.
Output Discovery:
https://p.libren.ms/view/a26abdea
Most of the time when a server doesn’t send this data it’s because you’ve got it restricted in snmpd.conf. Use our included one if you aren’t sure how to configure it.
strange if it is that. I have added the server with the same community as the others. It’s about Windows server 2012 R2. I have add the community and it accepts from any client. I can see that the % is changing but the graphs aren’t filled.
thanks
I suspect it is something in the configuration. Second server I added has the same issue. I had configured 1 min polling in the past. When I saw it was stopping the graphs I had disabled it. Could it be that there is some configuration not turned off?
You can’t really flick between 1 min and 5 min polling. You need to run the script to convert the rrd files.
However - non of that will stop discovery initially finding the info. The poller debug you posted shows data is being collected for processors on that device. What are you not seeing?
The graphs aren’t filling. before readding it did. but only the CPU wasn’t showing any data. now it’s all the graphs that are not showing the lines if you understand what I mean.
I have fixed the issue this morning. I had to delete the Windows server and reboot the librenms server after that I have added the server again and now it’s showing the graphs again.
