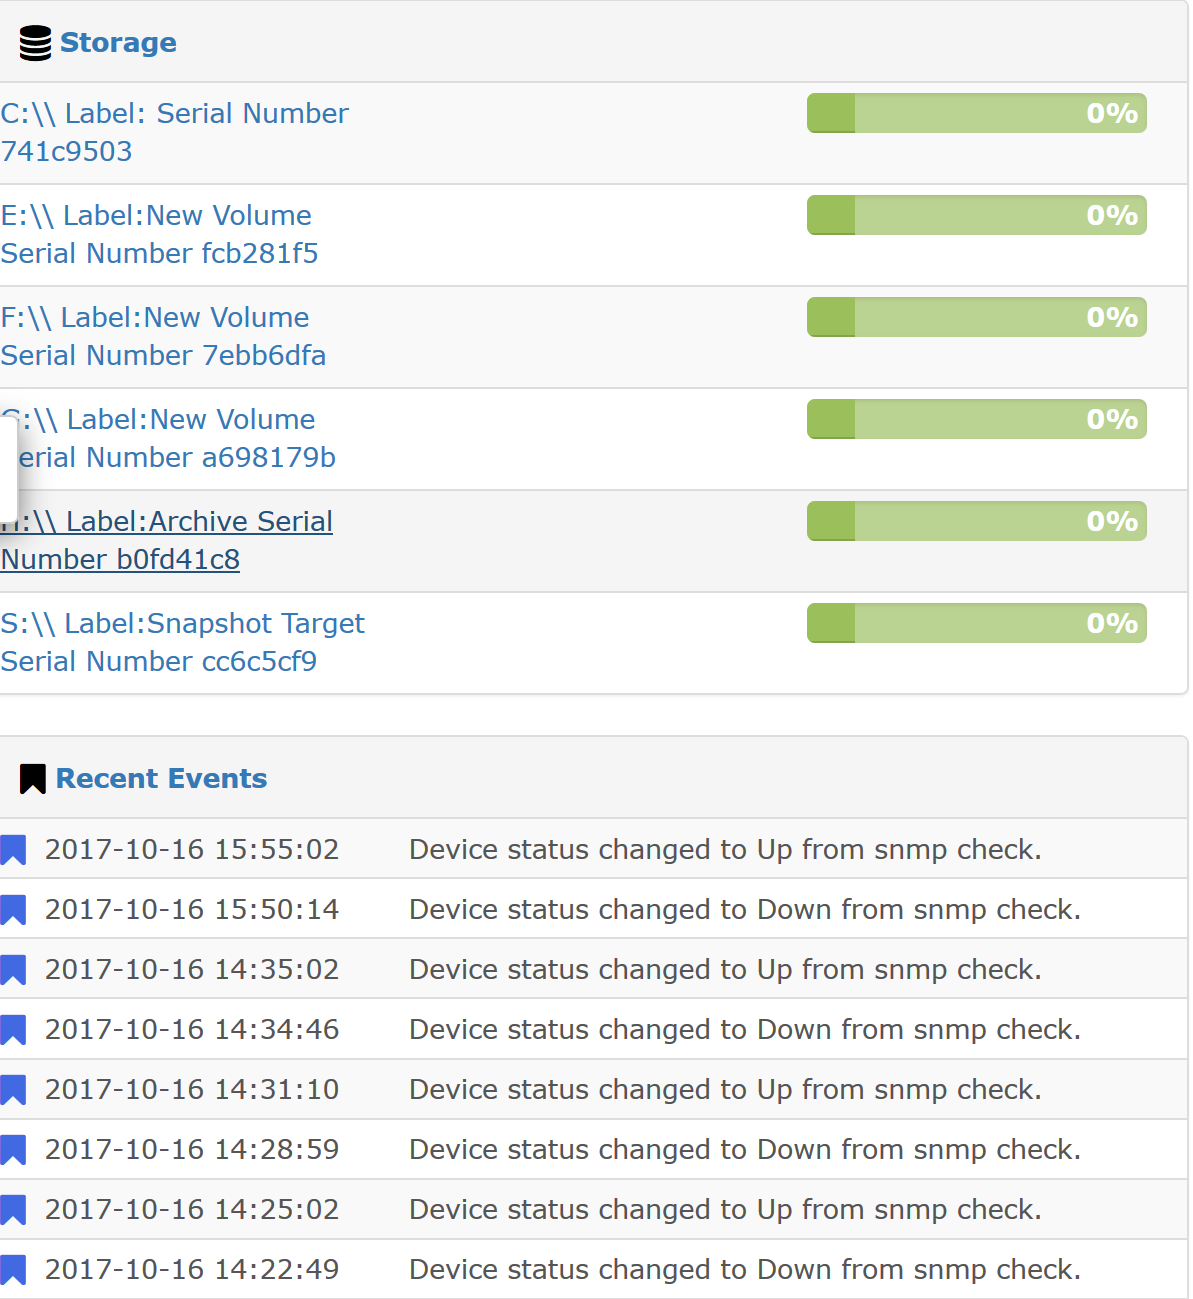
About two months ago, the storage information in LibreNMS for our file server started to show blank spots in the graphs. It progressed to the point where most of the data regarding storage on this server was missing and the graphs were blank.
I read over the following post and tried deleting the server from LibreNMS and re-adding it but it still does not properly detect the storage information anymore.
Unfortunately, I did not take a screenshot of the previous months graphs and have already deleted and re-added the server.
====================================
Component
Version
LibreNMS
1.32-45-g1318e58
DB Schema
210
PHP
7.0.22-0ubuntu0.16.04.1
MySQL
10.0.31-MariaDB-0ubuntu0.16.04.2
RRDTool
1.5.5
SNMP
NET-SNMP 5.7.3
====================================
[OK] Database connection successful
[OK] Database schema correct
[WARN] Your install is over 24 hours out of date, last update: Sun, 15 Oct 2017 20:06:11 +0000
[WARN] Some devices have not been polled in the last 5 minutes.
You may have performance issues. Check your poll log and see: Performance - LibreNMS Docs
I’ve been working on the performance documents but it seems to have made little difference.
I thought I had but I went back and missed a couple of lines that needed to be uncommented. I took care of that and restarted rrdcached. We’ll wait and see if it has an effect.
I’m not sure if it is related at all but in looking at the change log for this system, it appears that it may have started about the same time that Veeam Agent was installed on the server. Does anyone know if the agent for some reason takes over listening for snmp? Grasping at straws
Thanks, Kevin. I just checked it out and it looks like it was pulled down 2 days ago to our system and the graphs have been working since then. Great work!

 those guys/gals are heroes in my book.