Server has high perfomace.(cpu:E5-2680 mem:384G disk:ssd)
Mysql + Mancache + Nginx + Php7.0 php-fpm
I had done some tuning on mysql,but page is still open very slowlly(every page over 10s).
Could you show me some tuning ways to help this slow issue.
Thanks for your reply.
We don’t have many user,almost 10 - 15 users and they won’t online at same time.
I don’t think user due to slow page.
varnish is a good hint for me.
I will try it,and report later.
Thanks for your reply.
Page will show sucessfully at last.
Maby not time out case.
Here is the result:
fatal: No names found, cannot describe anything.
Component
Version
LibreNMS
DB Schema
252
PHP
7.0.27-0+deb9u1
MySQL
5.7.22-log
RRDTool
1.6.0
SNMP
NET-SNMP 5.7.3
====================================
[OK] Composer Version: 1.6.5
[OK] Dependencies up-to-date.
[OK] Database connection successful
[OK] Database schema correct
[WARN] Some devices have not been polled in the last 5 minutes. You may have performance issues.
[FIX] Check your poll log and see: http://docs.librenms.org/Support/Performance/
Devices:
10.163.104.151
10.163.105.120
10.60.6.44
43.230.90.126
10.163.72.18
10.80.163.137
10.163.103.35
[FAIL] Some devices have not completed their polling run in 5 minutes, this will create gaps in data.
[FIX] Check your poll log and see: http://docs.librenms.org/Support/Performance/
Devices:
10.80.163.118
fatal: No names found, cannot describe anything.
[WARN] Your install is over 24 hours out of date, last update: Thu, 14 Jun 2018 07:31:14 +0000
[FIX] Make sure your daily.sh cron is running and run ./daily.sh by hand to see if there are any errors.
[WARN] Your local git contains modified files, this could prevent automatic updates.
[FIX] You can fix this with ./scripts/github-remove
Modified Files:
includes/defaults.inc.php
[FAIL] We have found some files that are owned by a different user than librenms, this will stop you updating automatically and / or rrd files being updated causing graphs to fail.
[FIX] chown -R librenms:librenms /home/librenms
Files:
/home/librenms/tmp/PqN64LeySfxnTvEw
/home/librenms/tmp/iorLwzjV8yeuItAE
/home/librenms/tmp/pei3XmUhwqe7h20c
/home/librenms/tmp/sjJDNowWwmUXcaUN
/home/librenms/tmp/wf8gIaG7ET3NrEBB
/home/librenms/tmp/3XvC6ppvMVTsiemJ
/home/librenms/tmp/4LRa0Y9l0g9fxQrH
/home/librenms/tmp/cRFnsatqLVSic6Wd
/home/librenms/tmp/yZRex8f3jvuedENU
I set the slowlog at mysql and php-fpm.
Then I didn’t find anything strange at log,but page is slowly.
mysql slowlog:
…skipping…
SET timestamp=1530064175;
SELECT COUNT(*) FROM ports AS I, devices AS D WHERE I.deleted = ‘0’ AND D.device_id = I.device_id AND I.ignore = ‘0’ AND D.ignore = ‘0’ AND I.ifOperStatus = ‘up’;
SET timestamp=1530064185;
SELECT COUNT(*) FROM ports AS I, devices AS D WHERE I.deleted = ‘0’ AND D.device_id = I.device_id AND I.ignore = ‘0’ AND D.ignore = ‘0’ AND I.ifOperStatus = ‘down’ AND I.ifAdminStatus = ‘up’;
SET timestamp=1530064188;
SELECT COUNT(*) FROM ports AS I, devices AS D WHERE I.deleted = ‘0’ AND D.device_id = I.device_id AND I.ignore = ‘0’ AND D.ignore = ‘0’ AND I.ifAdminStatus = ‘down’;
SET timestamp=1530064235;
SELECT COUNT(*) FROM ports AS I, devices AS D WHERE I.deleted = ‘0’ AND D.device_id = I.device_id AND I.ignore = ‘0’ AND D.ignore = ‘0’ AND I.ifOperStatus = ‘up’;
SET timestamp=1530064240;
SELECT COUNT(*) FROM ports AS I, devices AS D WHERE I.deleted = ‘0’ AND D.device_id = I.device_id AND I.ignore = ‘0’ AND D.ignore = ‘0’ AND (I.ifInErrors_delta > ‘0’ OR I.ifOutErrors_delta > ‘0’);
SET timestamp=1530064247;
SELECT COUNT(*) FROM ports AS I, devices AS D WHERE I.deleted = ‘0’ AND D.device_id = I.device_id AND I.ignore = ‘0’ AND D.ignore = ‘0’ AND I.ifAdminStatus = ‘down’;
php-fpd (seted 500 child already)
[27-Jun-2018 09:43:46] WARNING: [pool www] child 60322, script ‘/home/librenms/html/ajax_dash.php’ (request: “POST /ajax_dash.php”) executing too slow (5.064481 sec), logging
[27-Jun-2018 09:43:46] NOTICE: child 60322 stopped for tracing
[27-Jun-2018 09:43:46] NOTICE: about to trace 60322
[27-Jun-2018 09:43:46] NOTICE: finished trace of 60322
[27-Jun-2018 09:45:33] WARNING: [pool www] child 60307, script ‘/home/librenms/html/index.php’ (request: “GET /index.php”) executing too slow (5.927246 sec), logging
[27-Jun-2018 09:45:33] NOTICE: child 60307 stopped for tracing
[27-Jun-2018 09:45:33] NOTICE: about to trace 60307
[27-Jun-2018 09:45:33] NOTICE: finished trace of 60307
[27-Jun-2018 09:50:45] WARNING: [pool www] child 60372, script ‘/home/librenms/html/index.php’ (request: “GET /index.php”) executing too slow (5.636717 sec), logging
[27-Jun-2018 09:50:45] NOTICE: child 60372 stopped for tracing
[27-Jun-2018 09:50:45] NOTICE: about to trace 60372
[27-Jun-2018 09:50:45] NOTICE: finished trace of 60372
[27-Jun-2018 09:55:58] WARNING: [pool www] child 60387, script ‘/home/librenms/html/index.php’ (request: “GET /index.php”) executing too slow (6.030887 sec), logging
[27-Jun-2018 09:55:58] NOTICE: child 60387 stopped for tracing
[27-Jun-2018 09:55:58] NOTICE: about to trace 60387
[27-Jun-2018 09:55:58] NOTICE: finished trace of 60387
Look at my results:
MariaDB [librenms]> SELECT COUNT() FROM ports AS I, devices AS D WHERE I.deleted = ‘0’ AND D.device_id = I.device_id AND I.ignore = ‘0’ AND D.ignore = ‘0’ AND (I.ifInErrors_delta > ‘0’ OR I.ifOutErrors_delta > ‘0’);
±---------+
| COUNT() |
±---------+
| 69 |
±---------+
1 row in set (0.13 sec)
With Adding USE INDEX (PRIMARY)
MariaDB [librenms]> SELECT COUNT(*) FROM ports AS I USE INDEX (PRIMARY), devices AS D WHERE I.deleted = '0' AND D.device_id = I.device_id AND I.ignore = '0' AND D.ignore = '0' AND (I.ifInErrors_delta > '0' OR I.ifOutErrors_delta > '0') ;
±---------+
| COUNT(*) |
±---------+
| 70 |
±---------+
1 row in set (0.04 sec)
Second query 3 times faster
SQL code need to some optimizations in my opinion
UPD:
same here
MariaDB [librenms]> SELECT COUNT() FROM ports AS I, devices AS D WHERE I.deleted = ‘0’ AND D.device_id = I.device_id AND I.ignore = ‘0’ AND D.ignore = ‘0’ AND I.ifAdminStatus = ‘down’;
±---------+
| COUNT() |
±---------+
| 310 |
±---------+
1 row in set (0.15 sec)
MariaDB [librenms]> SELECT COUNT() FROM ports AS I USE INDEX (PRIMARY), devices AS D WHERE I.deleted = ‘0’ AND D.device_id = I.device_id AND I.ignore = ‘0’ AND D.ignore = ‘0’ AND I.ifAdminStatus = ‘down’;
±---------+
| COUNT() |
±---------+
| 310 |
±---------+
1 row in set (0.04 sec)
mysql> explain SELECT COUNT(event_id) FROM eventlog AS E LEFT JOIN devices AS D ON E.host=D.device_id WHERE 1;
±—±------------±------±-----------±-------±--------------±--------±--------±----------------±---------±---------±-------------------------+
| id | select_type | table | partitions | type | possible_keys | key | key_len | ref | rows | filtered | Extra |
±—±------------±------±-----------±-------±--------------±--------±--------±----------------±---------±---------±-------------------------+
| 1 | SIMPLE | E | NULL | index | NULL | host | 4 | NULL | 44501962 | 100.00 | Using index |
| 1 | SIMPLE | D | NULL | eq_ref | PRIMARY | PRIMARY | 4 | librenms.E.host | 1 | 100.00 | Using where; Using index |
±—±------------±------±-----------±-------±--------------±--------±--------±----------------±---------±---------±-------------------------+
2 rows in set, 1 warning (0.03 sec)
mysql> SELECT COUNT(event_id) FROM eventlog AS E LEFT JOIN devices AS D ON E.host=D.device_id WHERE 1;
±----------------+
| COUNT(event_id) |
±----------------+
| 47873039 |
±----------------+
1 row in set (2 min 35.92 sec)
mysql> SELECT COUNT(event_id) FROM eventlog;
±----------------+
| COUNT(event_id) |
±----------------+
| 47873425 |
±----------------+
1 row in set (7.69 sec)
mysql> desc eventlog;
±----------±-------------±-----±----±--------------------±---------------+
| Field | Type | Null | Key | Default | Extra |
±----------±-------------±-----±----±--------------------±---------------+
| event_id | int(11) | NO | PRI | NULL | auto_increment |
| host | int(11) | NO | MUL | 0 | |
| device_id | int(11) | NO | MUL | NULL | |
| datetime | datetime | NO | MUL | 1970-01-02 00:00:01 | |
| message | text | YES | | NULL | |
| type | varchar(64) | YES | | NULL | |
| reference | varchar(64) | NO | | NULL | |
| username | varchar(128) | YES | | NULL | |
| severity | int(1) | YES | | 2 | |
±----------±-------------±-----±----±--------------------±---------------+
9 rows in set (0.00 sec)
Hi
Is there official test data available? For example, 2000 devices can also be applied to this system.
We are currently working on libre to replace our existing monitoring environment.
Now that this page has been found to open slowly, I would like to know if it was caused by too many devices or because of configuration problems. I monitored the resources of the server and it was determined that it was not due to resource issues.
Another topic, I think the database has a lot of optimization space, especially the switch log, the number is particularly large, whether you can consider using parttion, in the deletion of old data, it should be particularly good. Of course, this is my personal opinion.
MySQL needs to tuning on large data amount, as you have (47 mln rows)
May be indexes doesn’t fit mysql memory allocation. Can you show output of mysqltuner.pl ?
Thanks for your reply.
Here is result.
I have done the optimit except query_cache.
MySQLTuner 1.7.9 - Major Hayden [email protected]
Bug reports, feature requests, and downloads at http://mysqltuner.com/
Run with ‘–help’ for additional options and output filtering
[–] Skipped version check for MySQLTuner script
[!!] Attempted to use login credentials from debian maintena
nce account, but they failed.
root@librenms-db-1:~# /root/mysqltuner.pl --user librenms --pass librenms
MySQLTuner 1.7.9 - Major Hayden [email protected]
Bug reports, feature requests, and downloads at http://mysqltuner.com/
Run with ‘–help’ for additional options and output filtering
[–] Skipped version check for MySQLTuner script
[OK] Logged in using credentials passed on the command line
[!!] failed to execute: SHOW SLAVE STATUS\G
[!!] FAIL Execute SQL / return code: 256
[!!] failed to execute: SHOW SLAVE HOSTS
[!!] FAIL Execute SQL / return code: 256
[OK] Currently running supported MySQL version 5.7.22-log
[OK] Operating on 64-bit architecture
-------- Log file Recommendations ------------------------------------------------------------------
[–] Log file: /var/log/mysql/error.log(0B)
[OK] Log file /var/log/mysql/error.log exists
[OK] Log file /var/log/mysql/error.log is readable.
[!!] Log file /var/log/mysql/error.log is empty
[OK] Log file /var/log/mysql/error.log is smaller than 32 Mb
[OK] /var/log/mysql/error.log doesn’t contain any warning.
[OK] /var/log/mysql/error.log doesn’t contain any error.
[–] 0 start(s) detected in /var/log/mysql/error.log
[–] 0 shutdown(s) detected in /var/log/mysql/error.log
-------- Storage Engine Statistics -----------------------------------------------------------------
[–] Status: +ARCHIVE +BLACKHOLE +CSV -FEDERATED +InnoDB +MEMORY +MRG_MYISAM +MyISAM +PERFORMANCE_SCHEMA
[–] Data in InnoDB tables: 11G (Tables: 117)
[!!] Total fragmented tables: 1
-------- Security Recommendations ------------------------------------------------------------------
[!!] failed to execute: SELECT CONCAT(user, ‘@’, host) FROM mysql.user WHERE TRIM(USER) = ‘’ OR USER IS NULL
[!!] FAIL Execute SQL / return code: 256
[OK] There are no anonymous accounts for any database users
[!!] failed to execute: SELECT CONCAT(user, ‘@’, host) FROM mysql.user WHERE (IF(plugin=‘mysql_native_password’, authentication_string, ‘password’) = ‘’ OR IF(plugin=‘mysql_native_password’, authentication_string, ‘password’) IS NULL) AND plugin NOT IN (‘unix_socket’, ‘win_socket’, ‘auth_pam_compat’)
[!!] FAIL Execute SQL / return code: 256
[OK] All database users have passwords assigned
[!!] failed to execute: SELECT CONCAT(user, ‘@’, host) FROM mysql.user WHERE CAST(IF(plugin=‘mysql_native_password’, authentication_string, ‘password’) as Binary) = PASSWORD(user) OR CAST(IF(plugin=‘mysql_native_password’, authentication_string, ‘password’) as Binary) = PASSWORD(UPPER(user)) OR CAST(IF(plugin=‘mysql_native_password’, authentication_string, ‘password’) as Binary) = PASSWORD(CONCAT(UPPER(LEFT(User, 1)), SUBSTRING(User, 2, LENGTH(User))))
[!!] FAIL Execute SQL / return code: 256
[!!] failed to execute: SELECT CONCAT(user, ‘@’, host) FROM mysql.user WHERE HOST=‘%’
[!!] FAIL Execute SQL / return code: 256
[!!] There is no basic password file list!
-------- CVE Security Recommendations --------------------------------------------------------------
[–] Skipped due to --cvefile option undefined
[!!] failed to execute: SHOW ENGINE PERFORMANCE_SCHEMA STATUS
[!!] FAIL Execute SQL / return code: 256
[!!] failed to execute: SHOW ENGINE PERFORMANCE_SCHEMA STATUS
[!!] FAIL Execute SQL / return code: 256
-------- Performance Metrics -----------------------------------------------------------------------
[–] Up for: 10d 21h 32m 25s (3B q [3K qps], 14M conn, TX: 3020G, RX: 2032G)
[–] Reads / Writes: 23% / 77%
[–] Binary logging is enabled (GTID MODE: ON)
[–] Physical Memory : 377.8G
[–] Max MySQL memory : 37.2G
[–] Other process memory: 153.7M
[–] Total buffers: 32.6G global + 1.1M per thread (4190 max threads)
[!!] failed to execute: SHOW ENGINE PERFORMANCE_SCHEMA STATUS
[!!] FAIL Execute SQL / return code: 256
[–] P_S Max memory usage: 0B
[–] Galera GCache Max memory usage: 0B
[OK] Maximum reached memory usage: 34.7G (9.19% of installed RAM)
[OK] Maximum possible memory usage: 37.2G (9.84% of installed RAM)
[OK] Overall possible memory usage with other process is compatible with memory available
[OK] Slow queries: 0% (163K/3B)
[OK] Highest usage of available connections: 46% (1948/4190)
[OK] Aborted connections: 0.00% (11/14045427)
[!!] Query cache may be disabled by default due to mutex contention.
[!!] Query cache efficiency: 19.8% (174M cached / 881M selects)
[!!] Query cache prunes per day: 79785
[OK] Sorts requiring temporary tables: 0% (40K temp sorts / 52M sorts)
[OK] No joins without indexes
[OK] Temporary tables created on disk: 1% (225K on disk / 19M total)
[OK] Thread cache hit rate: 99% (72K created / 14M connections)
[OK] Table cache hit rate: 21% (4K open / 18K opened)
[OK] Open file limit used: 0% (7/5K)
[OK] Table locks acquired immediately: 100% (188K immediate / 188K locks)
[OK] Binlog cache memory access: 100.00% (2080597835 Memory / 2080597964 Total)
-------- Performance schema ------------------------------------------------------------------------
[!!] failed to execute: SHOW ENGINE PERFORMANCE_SCHEMA STATUS
[!!] FAIL Execute SQL / return code: 256
[–] Memory used by P_S: 0B
[–] Sys schema isn’t installed.
-------- ThreadPool Metrics ------------------------------------------------------------------------
[–] ThreadPool stat is disabled.
-------- MyISAM Metrics ----------------------------------------------------------------------------
[!!] Key buffer used: 18.2% (1M used / 8M cache)
[!!] Cannot calculate MyISAM index size - re-run script as root user
-------- InnoDB Metrics ----------------------------------------------------------------------------
[–] InnoDB is enabled.
[–] InnoDB Thread Concurrency: 80
[OK] InnoDB File per table is activated
[OK] InnoDB buffer pool / data size: 32.0G/11.9G
[OK] Ratio InnoDB log file size / InnoDB Buffer pool size: 1.0G * 8/32.0G should be equal 25%
[OK] InnoDB buffer pool instances: 32
[–] Number of InnoDB Buffer Pool Chunk : 32 for 32 Buffer Pool Instance(s)
[OK] Innodb_buffer_pool_size aligned with Innodb_buffer_pool_chunk_size & Innodb_buffer_pool_instances
[OK] InnoDB Read buffer efficiency: 100.00% (2007844893456 hits/ 2007845234870 total)
[OK] InnoDB Write log efficiency: 99.92% (3345341016 hits/ 3347895931 total)
[OK] InnoDB log waits: 0.00% (0 waits / 2554915 writes)
-------- AriaDB Metrics ----------------------------------------------------------------------------
[–] AriaDB is disabled.
-------- TokuDB Metrics ----------------------------------------------------------------------------
[–] TokuDB is disabled.
-------- XtraDB Metrics ----------------------------------------------------------------------------
[–] XtraDB is disabled.
-------- RocksDB Metrics ---------------------------------------------------------------------------
[–] RocksDB is disabled.
-------- Spider Metrics ----------------------------------------------------------------------------
[–] Spider is disabled.
-------- Connect Metrics ---------------------------------------------------------------------------
[–] Connect is disabled.
-------- Galera Metrics ----------------------------------------------------------------------------
[–] Galera is disabled.
-------- Replication Metrics -----------------------------------------------------------------------
[–] Galera Synchronous replication: NO
[–] No replication slave(s) for this server.
[–] Binlog format: ROW
[–] XA support enabled: ON
[–] Semi synchronous replication Master: Not Activated
[–] Semi synchronous replication Slave: Not Activated
[–] This is a standalone server
-------- Recommendations ---------------------------------------------------------------------------
General recommendations:
Run OPTIMIZE TABLE to defragment tables for better performance
OPTIMIZE TABLE librenms.device_perf; – can free 668 MB
Total freed space after theses OPTIMIZE TABLE : 668 Mb
Increasing the query_cache size over 128M may reduce performance
Consider installing Sys schema from GitHub - mysql/mysql-sys: The MySQL sys schema
Variables to adjust:
query_cache_size (=0)
query_cache_type (=0)
query_cache_limit (> 1M, or use smaller result sets)
query_cache_size (> 512M) [see warning above]
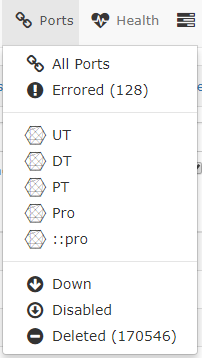
I found a strange phenomenon and hope to answer questions.
What does the Deteted meaning?
I check the php code and database.
sql:
SELECT * FROM ports AS P, devices as D WHERE P.deleted = ‘1’ AND D.device_id = P.device_id
mysql> SELECT count() FROM ports AS P, devices as D WHERE P.deleted = ‘1’ AND D.device_id = P.device_id;
±---------+
| count() |
±---------+
| 170610 |
±---------+
1 row in set (0.52 sec)
PHP:
$deleted_ports = 0;
foreach (dbFetchRows(“SELECT * FROM ports AS P, devices as D WHERE P.deleted = ‘1’ AND D.device_id = P.device_id”) as $interface) {
if (port_permitted($interface[‘port_id’], $interface[‘device_id’])) {
$deleted_ports++;
}
}
?>