There have been some times where LibreNMS seems to take forever to load a page or graph.
What do you think takes up the most time when drawing a graph? I would have guessed drawing the actual graph, but that was very wrong. Turns out previously, only 5% of the php processing time to create graph images was creating the image. 5%!
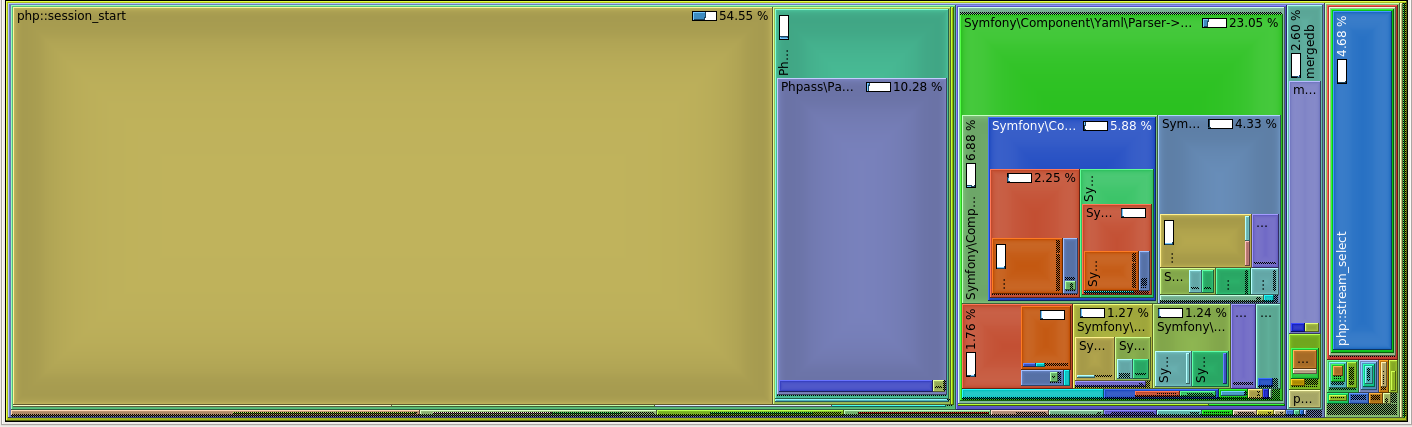
Here is the visualization of function calls during loading of graphs. I’ll highlight a few items:
- session_start() takes a whopping 55% of the wait time! session_start() is called to open a new session, but only one php process can have a session open for writing at one time. Guess what, we never closed the session for writing until the process exits. In effect this eliminates the possibility for parallel processing of graphs.
- 15% of the time is spent calculating hashes, even though the session is likely already authenticated.
- 23% of the time is spent parsing yaml files. The problem here is we don’t know what OS we need or we need many OS, so we have to call this a lot of times!
- The stream_select on the far right is us waiting for rrdtool to return the graph. It is 5% of the wait time.
So, how do we fix this?
For the os yaml parsing, we simply cache the full set os definitions and load that instead of parsing all the files.
To fix session_start() we call session_write_close() as soon as we can. This allows session variables to still be read, but they cannot be saved. But there is still a problem here, the password hashing we do is in between these two calls, that means we block other threads while we needlessly hash passwords.
So, if we can reduce the amount of time hashing passwords, we will get a multi-factor speed increase. The fix here is simple, don’t hash unless we need to. If we already have an authenticated session, trust that and only calculate hashes for new sessions. Doing as little work as possible when the session is already authenticated is the biggest speedup because we don’t block other requests.
The End Result
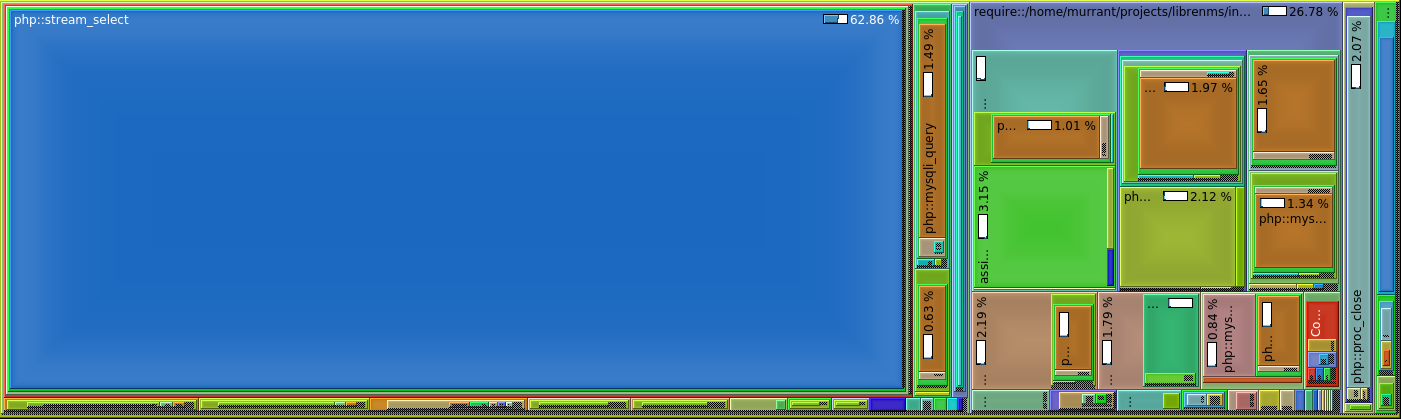
Now stream_select (which is us waiting for rrdtool to create the graph) is 63% of the wait time. We didn’t do anything to the amount of time this call takes so we can assume this takes the same time as before. According to my code profiling, the php run time for graphs was reduced by about 85%.
What does this mean in real numbers a page containing 46 graphs that took 6.8 seconds to load before now takes 3.4 seconds on my server (which has SSD storage). A 50% reduction in total page load time. There are many factors outside of how our code is written that affect total page load time. Please make sure your webserver and php (or php-fpm) are tuned for your needs.
These changes have been merged and will be in the next monthly release. If you are on the daily releases, please report any issues.