Put individual temperature sensor on dashboard?

To help monitor our server room temperature a bit better I want to put one individual temperature sensor from one of our servers as a widget on one of the dashboards so I don’t have to dig down into the individual server and then find the right sensor etc, however there doesn’t seem to be any way to do this ?

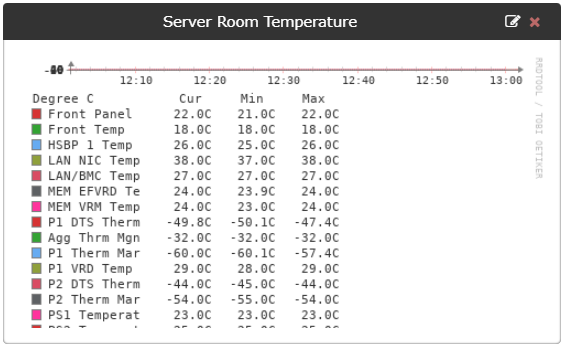
One approach is to add a Graph Widget with graph type sent to device_temperature, unfortunately there is no way to choose which sensor to display, so it just displays all of them… in a small box that can’t fit them all even if I wanted to.

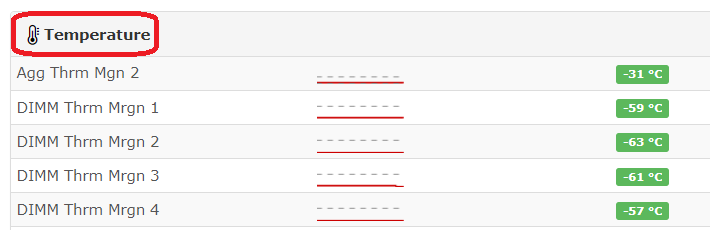
On a server with 21 temperature sensors it just ends up looking like this with the graph not even visible due to so many legends:

image

The sensor I’m interested in is “Front Temp”, although I’d like to rename it as well…

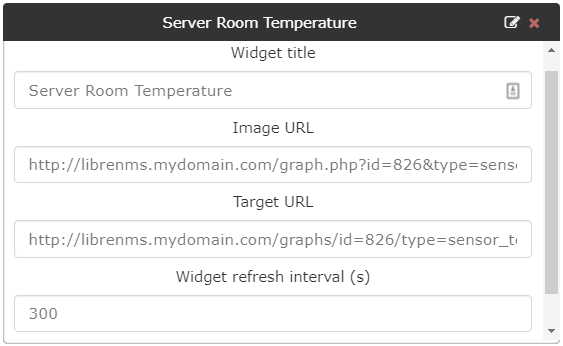
Ok, so how about the image widget ? That would do if I could find a fixed URL that shows the most recent 6 hour temperature graph for that one sensor, unfortunately the clickable URL’s for the graphs are all dynamically generated and include timestamps so any image URL I might use will soon be out of date.

Is there some way to do what I’m trying to do using the existing widgets or is it just not possible ?

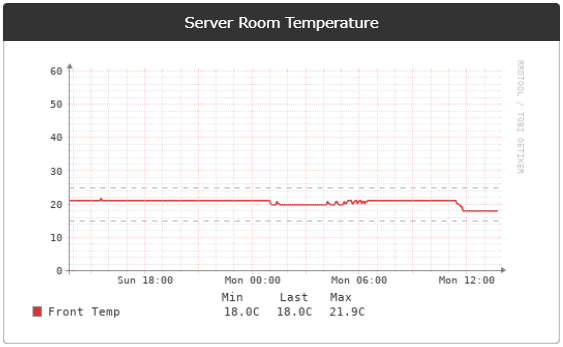
Ideally I’m trying to get the widget to look something like this:

image

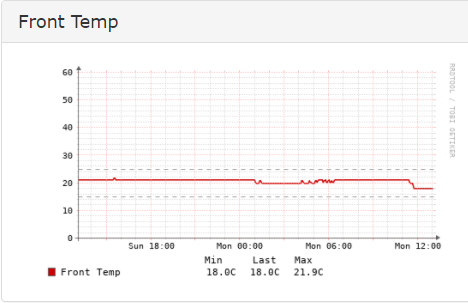
Although it would be nice to rename the sensor to “Server Room” as well.

Ok, I’ve managed to answer my own question, so for the benefit of anyone else trying to do the same it turns out it’s not hard to find a static link that will provide the last 24 hours of temperature graph for any individual sensor - this can then be used in the External Images Widget on the dashboard.

To do so, go to your server or device containing the sensor, click on the Temperature heading on the right: (not the individual sensor)

This takes you to a page of individual graphs for each sensor. Find the left most graph of the sensor you want:

Right click the graph and choose to copy the link address, paste that somewhere, then also copy the image address and past it somewhere.

They’ll look something like this:

Image:
http://librenms.mydomain.com/graph.php?id=826&type=sensor_temperature&height=193&width=415&from=1636292100

Link
http://librenms.mydomain.com/graphs/id=826/type=sensor_temperature/from=1636292100/

On the image link delete the &from= argument, and if you want you can adjust the height and width values to suit although I found these defaults fit inside a dashboard widget perfectly.

On the other link remove from= as well, so both links now look like this:

Image:
http://librenms.mydomain.com/graph.php?id=826&type=sensor_temperature&height=193&width=415

Link
http://librenms.mydomain.com/graphs/id=826/type=sensor_temperature/

You can now paste these into an external image widget:

image

And here is the resulting widget:

image

This seems to update correctly over time and clicking on the image will take you directly to the detailed temperature graphs for that sensor. Voila! :slight_smile:

Hope someone finds this useful.

5 Likes

This topic was automatically closed 7 days after the last reply. New replies are no longer allowed.