Ok, I’ve managed to answer my own question, so for the benefit of anyone else trying to do the same it turns out it’s not hard to find a static link that will provide the last 24 hours of temperature graph for any individual sensor - this can then be used in the External Images Widget on the dashboard.
To do so, go to your server or device containing the sensor, click on the Temperature heading on the right: (not the individual sensor)
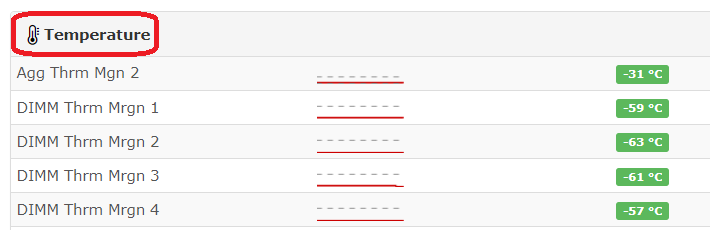
This takes you to a page of individual graphs for each sensor. Find the left most graph of the sensor you want:

Right click the graph and choose to copy the link address, paste that somewhere, then also copy the image address and past it somewhere.
They’ll look something like this:
Image:
http://librenms.mydomain.com/graph.php?id=826&type=sensor_temperature&height=193&width=415&from=1636292100

Link
http://librenms.mydomain.com/graphs/id=826/type=sensor_temperature/from=1636292100/
On the image link delete the &from= argument, and if you want you can adjust the height and width values to suit although I found these defaults fit inside a dashboard widget perfectly.
On the other link remove from= as well, so both links now look like this:
Image:
http://librenms.mydomain.com/graph.php?id=826&type=sensor_temperature&height=193&width=415

Link
http://librenms.mydomain.com/graphs/id=826/type=sensor_temperature/
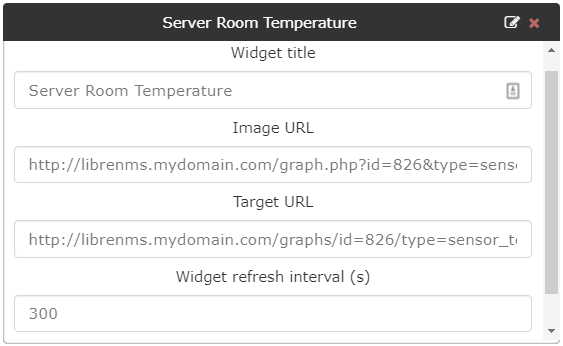
You can now paste these into an external image widget:
And here is the resulting widget:
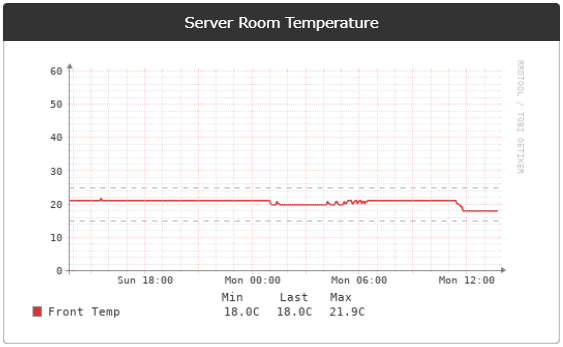
This seems to update correctly over time and clicking on the image will take you directly to the detailed temperature graphs for that sensor. Voila! ![]()
Hope someone finds this useful.