Speedtest Plugin

Dear all,

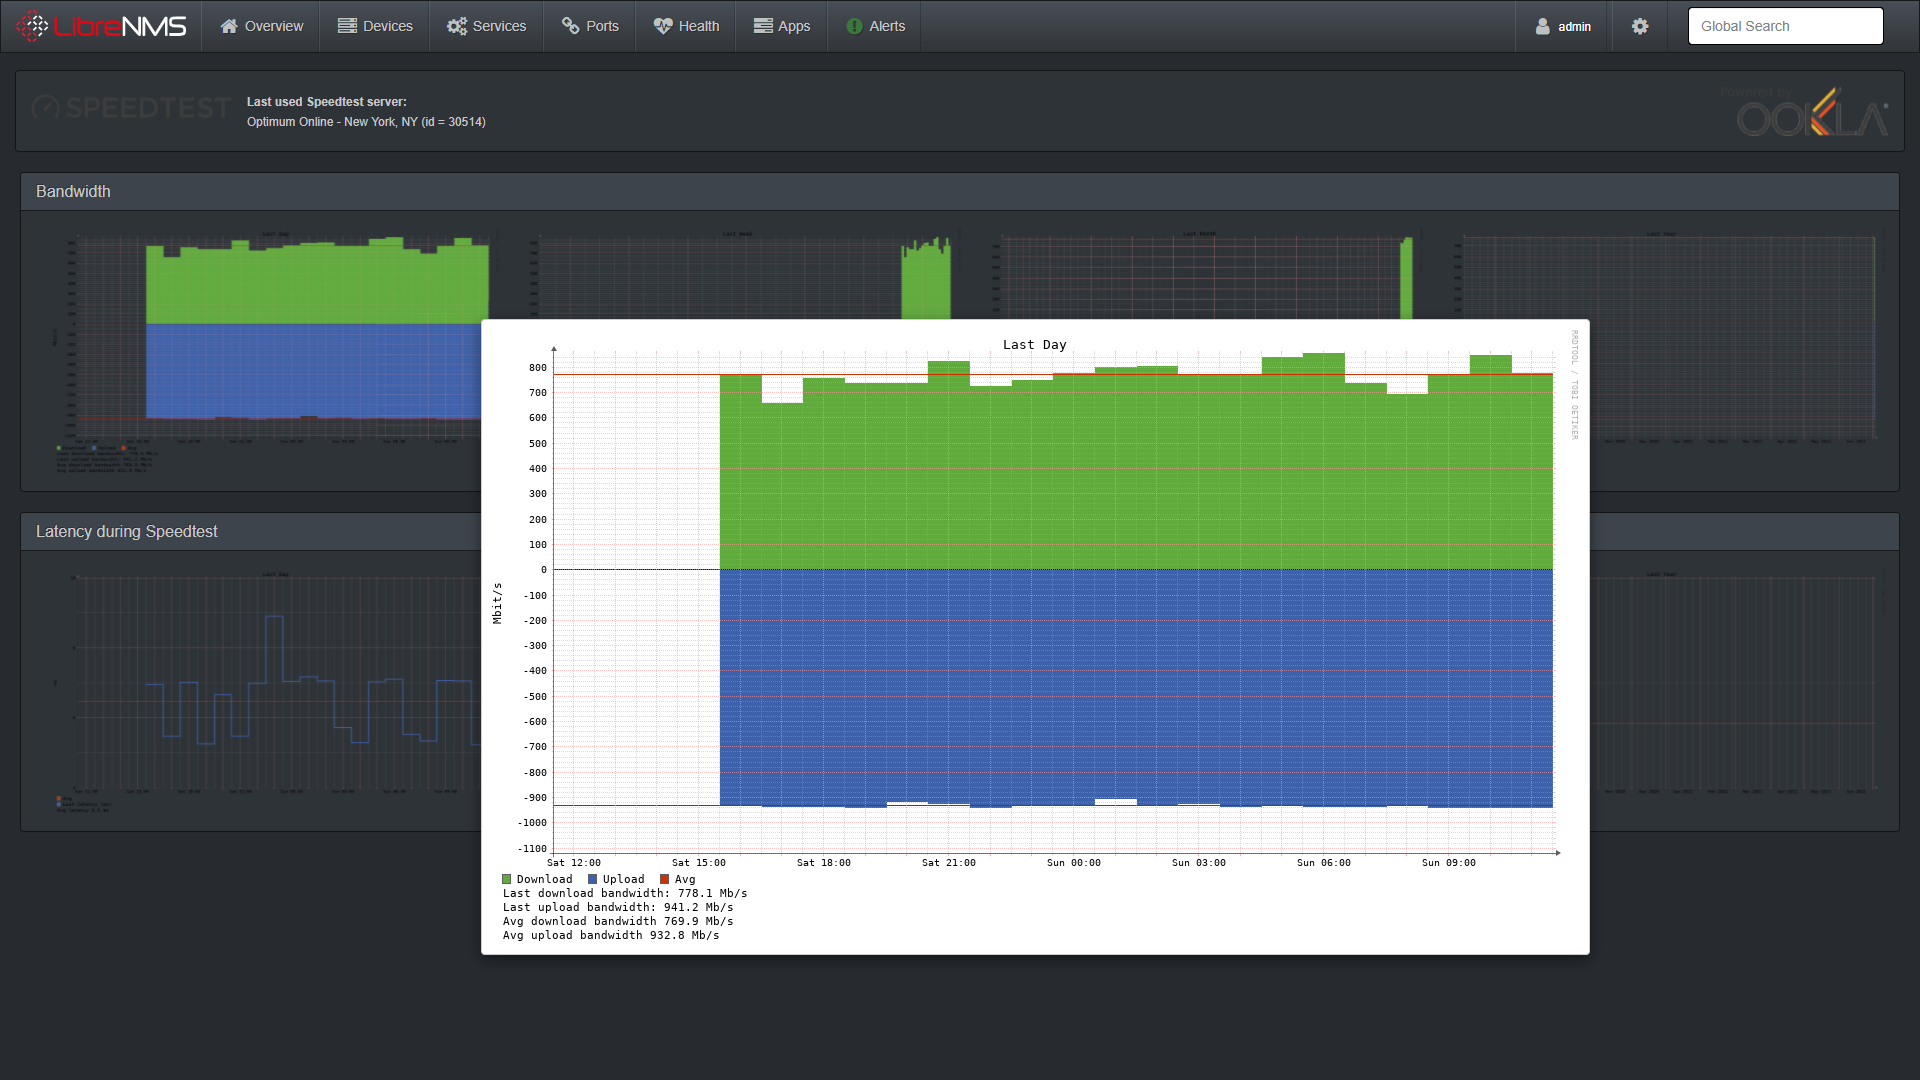
I created a Speedtest plugin that can be used to graph internet bandwidth. I had a need for this feature after we had some internet uplink shaping issues. I decided to properly release my code.

It’s not perfect, but it does the job :slight_smile:

Let me know what you think:
Jack Greyhat / LibreNMS Speedtest · GitLab

Suggestions are welcome!
Thanks!

5 Likes

that’s really cool - I need to try it out. Thank you for sharing!

Just an idea. Have the ability for multiple speedtest servers. That way we could install a remote polling server with speedtest at remote sites.

1 Like

Thank you @jackgreyhat great plugin and really good instructions for installation.

Excellent idea @Wolfraider.
Just swapped over to this from another speedtest plugin and the display is much better.
A way of running this at each location that’s monitored would be amazing.

Regards

Hi, I just installed your plugin but it isn’t graphing in Librenms. It is enabled, UI is there, after running /opt/librenms/html/plugins/Speedtest/librenms-speedtest.sh run && /opt/librenms/html/plugins/Speedtest/librenms-speedtest.sh graph, speedtest-bandwidth.rrd and speedtest-latency.rrd are created in /opt/librenms/html/plugins/Speedtest/rrd, speedtest-server and speedtest-results are created in /opt/librenms/html/plugins/Speedtest/tmp. Is there something I should look for to trouble shoot this?

Hi,

I have the same issue as many others according to Gitlab, Graphs are not being created. I tried to run it bash -x but rrdtool cannot find any PNG as it is not being created.:

rrdtool graph /opt/librenms/html/plugins/Speedtest/png/speedtest-latency-day.png -J -a PNG --start -1day '--title=Last Day' --vertical-label ms DEF:P=/opt/librenms/html/plugins/Speedtest/rrd/speedtest-latency.rrd:LATENCY:AVERAGE DEF:PMIN=/opt/librenms/html/plugins/Speedtest/rrd/speedtest-latency.rrd:LATENCY:MIN DEF:PMAX=/opt/librenms/html/plugins/Speedtest/rrd/speedtest-latency.rrd:LATENCY:MAX VDEF:Pavg=P,AVERAGE 'LINE1:Pavg#cc3300:Avg \n' 'LINE2:P#3d61ab:Last latency (ms)\n' 'GPRINT:Pavg:Avg latency %2.1lf ms\n' -h 500 -w 1000 -y1:2 -c BACK#EEEEEE00 -c SHADEA#EEEEEE00 -c SHADEB#EEEEEE00 -c CANVAS#FFFFFF00 -c GRID#a5a5a5 -c MGRID#FF9999 -c FRAME#5e5e5e -c ARROW#5e5e5e -R normal -c FONT#000000 --font LEGEND:8:DejaVuSansMono --font AXIS:7:DejaVuSansMono

This is the verbose output for the rrdtool command:
ERROR: the RRD does not contain an RRA matching the chosen CF

Probably found it… You create an png based on MIN / MAX / AVERAGE but these are not being set. When you fetch the rrd using rrdtool you only get AVERAGE back:

When changing the rrdtool command to this it works:
rrdtool graph /opt/librenms/html/plugins/Speedtest/png/speedtest-latency-day.png -J -a PNG --start -1day '--title=Last Day' --vertical-label ms DEF:P=/opt/librenms/html/plugins/Speedtest/rrd/speedtest-latency.rrd:LATENCY:AVERAGE DEF:PMIN=/opt/librenms/html/plugins/Speedtest/rrd/speedtest-latency.rrd:LATENCY:AVERAGE DEF:PMAX=/opt/librenms/html/plugins/Speedtest/rrd/speedtest-latency.rrd:LATENCY:AVERAGE VDEF:Pavg=P,AVERAGE 'LINE1:Pavg#cc3300:Avg \n' 'LINE2:P#3d61ab:Last latency (ms)\n' 'GPRINT:Pavg:Avg latency %2.1lf ms\n' -h 500 -w 1000 -y1:2 -c BACK#EEEEEE00 -c SHADEA#EEEEEE00 -c SHADEB#EEEEEE00 -c CANVAS#FFFFFF00 -c GRID#a5a5a5 -c MGRID#FF9999 -c FRAME#5e5e5e -c ARROW#5e5e5e -R normal -c FONT#000000 --font LEGEND:8:DejaVuSansMono --font AXIS:7:DejaVuSansMono

But it shows only average, no min or max, these values are not set by the bash script.

@Serverion in your last post how do you run this code, from terminal or do you edit librenms-speedtest.sh?

No we updated the .sh as it was referring to non existing variables. Many other have issues with the original version. It is also on Gitlab and Google.

@Serverion do you have a working librenms-speedtest.sh that you can share/post?

Sure, here you go:

#!/bin/bash
#############################
# LibreNMS Speedtest plugin #
#############################
# Main plugin dir
SpeedtestPluginDir=/opt/librenms/html/plugins/Speedtest
# Other data dirs
RRDGraphsDir=$SpeedtestPluginDir/rrd
PNGImagesDir=$SpeedtestPluginDir/png
SpeedtestResultDir=$SpeedtestPluginDir/tmp

# Active script code

        case $1 in (create)
                # Create the Latency measurement RRD
                rrdtool create $RRDGraphsDir/speedtest-latency.rrd -s 1800 \
                DS:LATENCY:GAUGE:3600:0:1000 \
                RRA:AVERAGE:0.5:1:576 \
                RRA:AVERAGE:0.5:6:672 \
                RRA:AVERAGE:0.5:24:732 \
                RRA:AVERAGE:0.5:144:1460

                # Create the Bandwidth measurement RRD
                rrdtool create $RRDGraphsDir/speedtest-bandwidth.rrd -s 1800 \
                DS:DOWN:GAUGE:3600:0:1000 \
                DS:UP:GAUGE:3600:0:1000 \
                RRA:AVERAGE:0.5:1:576 \
                RRA:AVERAGE:0.5:6:672 \
                RRA:AVERAGE:0.5:24:732 \
                RRA:AVERAGE:0.5:144:1460
                ;;
        (run)
                # Get the date of the moment we start the test, in epoch format
                DATE=$(/bin/date +%s)

                # Generate speedtest results, store them in a temp file
                speedtest --accept-license --accept-gdpr -p no > $SpeedtestResultDir/speedtest-results 2>/dev/null

                # Get the Latency
                Latency=$(cat $SpeedtestResultDir/speedtest-results | grep Latency | sed 's/.*Latency:\s*\([0-9]*.[0-9]*\).*/\1/')

                # Get the Download speed
                DownloadSpeed=$(cat $SpeedtestResultDir/speedtest-results | grep Download | sed 's/.*Download:\s*\([0-9]*.[0-9]*\).*/\1/')

                # Get the Upload speed
                UploadSpeed=$(cat $SpeedtestResultDir/speedtest-results | grep Upload | sed 's/.*Upload:\s*\([0-9]*.[0-9]*\).*/\1/')

                # Get the server that was used, dump it into a file
                cat $SpeedtestResultDir/speedtest-results | grep Server | sed 's/.*Server:\s*\(.*\)/\1/' > $SpeedtestResultDir/speedtest-server
                
                # Update the RRD graphs
                rrdtool update $RRDGraphsDir/speedtest-latency.rrd $DATE:$Latency
                rrdtool update $RRDGraphsDir/speedtest-bandwidth.rrd $DATE:$DownloadSpeed:$UploadSpeed
                ;;
        (graph)
                # Create the Latency PNG of the last day
                rrdtool graph $PNGImagesDir/speedtest-latency-day.png -J -a PNG --start "-1day" \
                --title="Last Day" \
                --vertical-label "ms" \
                DEF:P=$RRDGraphsDir/speedtest-latency.rrd:LATENCY:AVERAGE \
                DEF:PMIN=$RRDGraphsDir/speedtest-latency.rrd:LATENCY:AVERAGE \
                DEF:PMAX=$RRDGraphsDir/speedtest-latency.rrd:LATENCY:AVERAGE \
                VDEF:Pavg=P,AVERAGE \
                LINE1:Pavg#cc3300:"Avg \n" \
                LINE2:P#3d61ab:"Last latency (ms)\n" \
                GPRINT:Pavg:"Avg latency %2.1lf ms\n" \
                -h 500 -w 1000 -y1:2 \
                -c BACK#EEEEEE00 \
                -c SHADEA#EEEEEE00 \
                -c SHADEB#EEEEEE00 \
                -c CANVAS#FFFFFF00 \
                -c GRID#a5a5a5 \
                -c MGRID#FF9999 \
                -c FRAME#5e5e5e \
                -c ARROW#5e5e5e \
                -R normal \
                -c FONT#000000 \
                --font LEGEND:8:DejaVuSansMono \
                --font AXIS:7:DejaVuSansMono > /dev/null 2>&1

                # Create the Latency PNG of the last week
                rrdtool graph $PNGImagesDir/speedtest-latency-week.png -J -a PNG --start "-1week" \
                --title="Last Week" \
                --vertical-label "ms" \
                DEF:P=$RRDGraphsDir/speedtest-latency.rrd:LATENCY:AVERAGE \
                DEF:PMIN=$RRDGraphsDir/speedtest-latency.rrd:LATENCY:AVERAGE \
                DEF:PMAX=$RRDGraphsDir/speedtest-latency.rrd:LATENCY:AVERAGE \
                VDEF:Pavg=P,AVERAGE \
                LINE1:Pavg#cc3300:"Avg \n" \
                LINE2:P#3d61ab:"Last latency (ms)\n" \
                GPRINT:Pavg:"Avg latency %2.1lf ms\n" \
                -h 500 -w 1000 -y1:2 \
                -c BACK#EEEEEE00 \
                -c SHADEA#EEEEEE00 \
                -c SHADEB#EEEEEE00 \
                -c CANVAS#FFFFFF00 \
                -c GRID#a5a5a5 \
                -c MGRID#FF9999 \
                -c FRAME#5e5e5e \
                -c ARROW#5e5e5e \
                -R normal \
                -c FONT#000000 \
                --font LEGEND:8:DejaVuSansMono \
                --font AXIS:7:DejaVuSansMono > /dev/null 2>&1

                # Create the Latency PNG of the last month
                rrdtool graph $PNGImagesDir/speedtest-latency-month.png -J -a PNG --start "-1month" \
                --title="Last Month" \
                --vertical-label "ms" \
                DEF:P=$RRDGraphsDir/speedtest-latency.rrd:LATENCY:AVERAGE \
                DEF:PMIN=$RRDGraphsDir/speedtest-latency.rrd:LATENCY:AVERAGE \
                DEF:PMAX=$RRDGraphsDir/speedtest-latency.rrd:LATENCY:AVERAGE \
                VDEF:Pavg=P,AVERAGE \
                LINE1:Pavg#cc3300:"Avg \n" \
                LINE2:P#3d61ab:"Last latency (ms)\n" \
                GPRINT:Pavg:"Avg latency %2.1lf ms\n" \
                -h 500 -w 1000 -y1:2 \
                -c BACK#EEEEEE00 \
                -c SHADEA#EEEEEE00 \
                -c SHADEB#EEEEEE00 \
                -c CANVAS#FFFFFF00 \
                -c GRID#a5a5a5 \
                -c MGRID#FF9999 \
                -c FRAME#5e5e5e \
                -c ARROW#5e5e5e \
                -R normal \
                -c FONT#000000 \
                --font LEGEND:8:DejaVuSansMono \
                --font AXIS:7:DejaVuSansMono > /dev/null 2>&1

                # Create the Latency PNG of the last year
                rrdtool graph $PNGImagesDir/speedtest-latency-year.png -J -a PNG --start "-1year" \
                --title="Last Year" \
                --vertical-label "ms" \
                DEF:P=$RRDGraphsDir/speedtest-latency.rrd:LATENCY:AVERAGE \
                DEF:PMIN=$RRDGraphsDir/speedtest-latency.rrd:LATENCY:AVERAGE \
                DEF:PMAX=$RRDGraphsDir/speedtest-latency.rrd:LATENCY:AVERAGE \
                VDEF:Pavg=P,AVERAGE \
                LINE1:Pavg#cc3300:"Avg \n" \
                LINE2:P#3d61ab:"Last latency (ms)\n" \
                GPRINT:Pavg:"Avg latency %2.1lf ms\n" \
                -h 500 -w 1000 -y1:2 \
                -c BACK#EEEEEE00 \
                -c SHADEA#EEEEEE00 \
                -c SHADEB#EEEEEE00 \
                -c CANVAS#FFFFFF00 \
                -c GRID#a5a5a5 \
                -c MGRID#FF9999 \
                -c FRAME#5e5e5e \
                -c ARROW#5e5e5e \
                -R normal \
                -c FONT#000000 \
                --font LEGEND:8:DejaVuSansMono \
                --font AXIS:7:DejaVuSansMono > /dev/null 2>&1

                # Create the Bandwidth PNG of the last day
                rrdtool graph $PNGImagesDir/speedtest-bandwidth-day.png -J -a PNG --start "-1day" \
                --title="Last Day" \
                --vertical-label "Mbit/s" \
                DEF:D=$RRDGraphsDir/speedtest-bandwidth.rrd:DOWN:AVERAGE \
                DEF:DMIN=$RRDGraphsDir/speedtest-bandwidth.rrd:DOWN:AVERAGE \
                DEF:DMAX=$RRDGraphsDir/speedtest-bandwidth.rrd:DOWN:AVERAGE \
                DEF:U=$RRDGraphsDir/speedtest-bandwidth.rrd:UP:AVERAGE \
                DEF:UMIN=$RRDGraphsDir/speedtest-bandwidth.rrd:UP:AVERAGE \
                DEF:UMAX=$RRDGraphsDir/speedtest-bandwidth.rrd:UP:AVERAGE \
                CDEF:Y0=U,0,* \
                CDEF:NegU=U,-1,* \
                VDEF:Yavg=Y0,AVERAGE \
                VDEF:Davg=D,AVERAGE \
                VDEF:Uavg=NegU,AVERAGE \
                VDEF:Uavg2=U,AVERAGE \
                AREA:D#61ab3d:"Download" \
                AREA:NegU#3d61ab:"Upload" \
                LINE1:Uavg#cc1100: \
                LINE1:Davg#cc3300:"Avg\n" \
                LINE1:Yavg#111111: \
                GPRINT:D:LAST:"Last download bandwidth\: %2.1lf Mb/s\n" \
                GPRINT:U:LAST:"Last upload bandwidth\: %2.1lf Mb/s\n" \
                GPRINT:Davg:"Avg download bandwidth %2.1lf Mb/s\n" \
                GPRINT:Uavg2:"Avg upload bandwidth %2.1lf Mb/s" \
                -h 500 -w 1000 \
                -c BACK#EEEEEE00 \
                -c SHADEA#EEEEEE00 \
                -c SHADEB#EEEEEE00 \
                -c CANVAS#FFFFFF00 \
                -c GRID#a5a5a5 \
                -c MGRID#FF9999 \
                -c FRAME#5e5e5e \
                -c ARROW#5e5e5e \
                -R normal \
                -c FONT#000000 \
                --font LEGEND:8:DejaVuSansMono \
                --font AXIS:7:DejaVuSansMono > /dev/null 2>&1

                # Create the Bandwidth PNG of the last week
                rrdtool graph $PNGImagesDir/speedtest-bandwidth-week.png -J -a PNG --start "-1week" \
                --title="Last Week" \
                --vertical-label "Mbit/s" \
                DEF:D=$RRDGraphsDir/speedtest-bandwidth.rrd:DOWN:AVERAGE \
                DEF:DMIN=$RRDGraphsDir/speedtest-bandwidth.rrd:DOWN:AVERAGE \
                DEF:DMAX=$RRDGraphsDir/speedtest-bandwidth.rrd:DOWN:AVERAGE \
                DEF:U=$RRDGraphsDir/speedtest-bandwidth.rrd:UP:AVERAGE \
                DEF:UMIN=$RRDGraphsDir/speedtest-bandwidth.rrd:UP:AVERAGE \
                DEF:UMAX=$RRDGraphsDir/speedtest-bandwidth.rrd:UP:AVERAGE \
                CDEF:Y0=U,0,* \
                CDEF:NegU=U,-1,* \
                VDEF:Yavg=Y0,AVERAGE \
                VDEF:Davg=D,AVERAGE \
                VDEF:Uavg=NegU,AVERAGE \
                VDEF:Uavg2=U,AVERAGE \
                AREA:D#61ab3d:"Download" \
                AREA:NegU#3d61ab:"Upload" \
                LINE1:Uavg#cc1100: \
                LINE1:Davg#cc3300:"Avg\n" \
                LINE1:Yavg#111111: \
                GPRINT:D:LAST:"Last download bandwidth\: %2.1lf Mb/s\n" \
                GPRINT:U:LAST:"Last upload bandwidth\: %2.1lf Mb/s\n" \
                GPRINT:Davg:"Avg download bandwidth %2.1lf Mb/s\n" \
                GPRINT:Uavg2:"Avg upload bandwidth %2.1lf Mb/s" \
                -h 500 -w 1000 \
                -c BACK#EEEEEE00 \
                -c SHADEA#EEEEEE00 \
                -c SHADEB#EEEEEE00 \
                -c CANVAS#FFFFFF00 \
                -c GRID#a5a5a5 \
                -c MGRID#FF9999 \
                -c FRAME#5e5e5e \
                -c ARROW#5e5e5e \
                -R normal \
                -c FONT#000000 \
                --font LEGEND:8:DejaVuSansMono \
                --font AXIS:7:DejaVuSansMono > /dev/null 2>&1

                # Create the Bandwidth PNG of the last month
                rrdtool graph $PNGImagesDir/speedtest-bandwidth-month.png -J -a PNG --start "-1month" \
                --title="Last Month" \
                --vertical-label "Mbit/s" \
                DEF:D=$RRDGraphsDir/speedtest-bandwidth.rrd:DOWN:AVERAGE \
                DEF:DMIN=$RRDGraphsDir/speedtest-bandwidth.rrd:DOWN:AVERAGE \
                DEF:DMAX=$RRDGraphsDir/speedtest-bandwidth.rrd:DOWN:AVERAGE \
                DEF:U=$RRDGraphsDir/speedtest-bandwidth.rrd:UP:AVERAGE \
                DEF:UMIN=$RRDGraphsDir/speedtest-bandwidth.rrd:UP:AVERAGE \
                DEF:UMAX=$RRDGraphsDir/speedtest-bandwidth.rrd:UP:AVERAGE \
                CDEF:Y0=U,0,* \
                CDEF:NegU=U,-1,* \
                VDEF:Yavg=Y0,AVERAGE \
                VDEF:Davg=D,AVERAGE \
                VDEF:Uavg=NegU,AVERAGE \
                VDEF:Uavg2=U,AVERAGE \
                AREA:D#61ab3d:"Download" \
                AREA:NegU#3d61ab:"Upload" \
                LINE1:Uavg#cc1100: \
                LINE1:Davg#cc3300:"Avg\n" \
                LINE1:Yavg#111111: \
                GPRINT:D:LAST:"Last download bandwidth\: %2.1lf Mb/s\n" \
                GPRINT:U:LAST:"Last upload bandwidth\: %2.1lf Mb/s\n" \
                GPRINT:Davg:"Avg download bandwidth %2.1lf Mb/s\n" \
                GPRINT:Uavg2:"Avg upload bandwidth %2.1lf Mb/s" \
                -h 500 -w 1000 \
                -c BACK#EEEEEE00 \
                -c SHADEA#EEEEEE00 \
                -c SHADEB#EEEEEE00 \
                -c CANVAS#FFFFFF00 \
                -c GRID#a5a5a5 \
                -c MGRID#FF9999 \
                -c FRAME#5e5e5e \
                -c ARROW#5e5e5e \
                -R normal \
                -c FONT#000000 \
                --font LEGEND:8:DejaVuSansMono \
                --font AXIS:7:DejaVuSansMono > /dev/null 2>&1

                # Create the Bandwidth PNG of the last year
                rrdtool graph $PNGImagesDir/speedtest-bandwidth-year.png -J -a PNG --start "-1year" \
                --title="Last Year" \
                --vertical-label "Mbit/s" \
                DEF:D=$RRDGraphsDir/speedtest-bandwidth.rrd:DOWN:AVERAGE \
                DEF:DMIN=$RRDGraphsDir/speedtest-bandwidth.rrd:DOWN:AVERAGE \
                DEF:DMAX=$RRDGraphsDir/speedtest-bandwidth.rrd:DOWN:AVERAGE \
                DEF:U=$RRDGraphsDir/speedtest-bandwidth.rrd:UP:AVERAGE \
                DEF:UMIN=$RRDGraphsDir/speedtest-bandwidth.rrd:UP:AVERAGE \
                DEF:UMAX=$RRDGraphsDir/speedtest-bandwidth.rrd:UP:AVERAGE \
                CDEF:Y0=U,0,* \
                CDEF:NegU=U,-1,* \
                VDEF:Yavg=Y0,AVERAGE \
                VDEF:Davg=D,AVERAGE \
                VDEF:Uavg=NegU,AVERAGE \
                VDEF:Uavg2=U,AVERAGE \
                AREA:D#61ab3d:"Download" \
                AREA:NegU#3d61ab:"Upload" \
                LINE1:Uavg#cc1100: \
                LINE1:Davg#cc3300:"Avg\n" \
                LINE1:Yavg#111111: \
                GPRINT:D:LAST:"Last download bandwidth\: %2.1lf Mb/s\n" \
                GPRINT:U:LAST:"Last upload bandwidth\: %2.1lf Mb/s\n" \
                GPRINT:Davg:"Avg download bandwidth %2.1lf Mb/s\n" \
                GPRINT:Uavg2:"Avg upload bandwidth %2.1lf Mb/s" \
                -h 500 -w 1000 \
                -c BACK#EEEEEE00 \
                -c SHADEA#EEEEEE00 \
                -c SHADEB#EEEEEE00 \
                -c CANVAS#FFFFFF00 \
                -c GRID#a5a5a5 \
                -c MGRID#FF9999 \
                -c FRAME#5e5e5e \
                -c ARROW#5e5e5e \
                -R normal \
                -c FONT#000000 \
                --font LEGEND:8:DejaVuSansMono \
                --font AXIS:7:DejaVuSansMono > /dev/null 2>&1
                ;;

        (*)
                echo "Invalid option. Nothing to do. Please try again with: create - run - graph"
                ;;
        esac
1 Like

Thank You!

unfortunately it’s still not graphing

hotfix:

edit Speedtest.inc.php and modify for both speedtest and latency results as such:

<div class="col-md-3">
     <img src="https://YOURHOST/plugins/Speedtest/png/speedtest-bandwidth-day.png" width="900" height="500">
     <a onmouseover="return overlib('<div class=\'overlib-contents\'><img src=\'plugins/Speedtest/png/speedtest-bandwidth-day.png\' style=\'border:0;\' /></div>',FGCOLOR,'#ffffff', BGCOLOR, '#e5e5e5', BORDER, 5, CELLPAD, 4, CAPCOLOR, '#555555', TEXTCOLOR, '#3e3e3e',WRAP,HAUTO,VAUTO); " onmouseout="return nd();"><img class="lazy img-responsive" data-original="plugins/Speedtest/png/speedtest-bandwidth-day.png" style="border: 0" /></a>

Remember it’s just a hotfix, nothing more. Does the job for me.

Thanks, that got it working!

1 Like

I placed the <img src= between the <a> and </a>, set an img size that actually fits all 4 on a 1080p screen, and everything works flawlessly.

Here’s the chunk of edited code:

 <div class="panel-body">
                    <div class="col-md-3">
                        <a onmouseover="return overlib('<div class=\'overlib-contents\'><img src=\'plugins/Speedtest/png/speedtest-bandwidth-day.png\' style=\'border:0;\' /></div>',FGCOLOR,'#ffffff', BGCOLOR, '#e5e5e5', BORDER, 5, CELLPAD, 4, CAPCOLOR, '#555555', TEXTCOLOR, '#3e3e3e',WRAP,HAUTO,VAUTO); " onmouseout="return nd();"><img class="lazy img-responsive" data-original="plugins/Speedtest/png/speedtest-bandwidth-day.png" style="border: 0" /><img src="plugins/Speedtest/png/speedtest-bandwidth-day.png" width="450" height="250"></a>
                    </div>
                    <div class="col-md-3">
                        <a onmouseover="return overlib('<div class=\'overlib-contents\'><img src=\'plugins/Speedtest/png/speedtest-bandwidth-week.png\' style=\'border:0;\' /></div>',FGCOLOR,'#ffffff', BGCOLOR, '#e5e5e5', BORDER, 5, CELLPAD, 4, CAPCOLOR, '#555555', TEXTCOLOR, '#3e3e3e',WRAP,HAUTO,VAUTO); " onmouseout="return nd();"><img class="lazy img-responsive" data-original="plugins/Speedtest/png/speedtest-bandwidth-week.png" style="border: 0" /><img src="plugins/Speedtest/png/speedtest-bandwidth-week.png" width="450" height="250"></a>
                    </div>
                    <div class="col-md-3">
                        <a onmouseover="return overlib('<div class=\'overlib-contents\'><img src=\'plugins/Speedtest/png/speedtest-bandwidth-month.png\' style=\'border:0;\' /></div>',FGCOLOR,'#ffffff', BGCOLOR, '#e5e5e5', BORDER, 5, CELLPAD, 4, CAPCOLOR, '#555555', TEXTCOLOR, '#3e3e3e',WRAP,HAUTO,VAUTO); " onmouseout="return nd();"><img class="lazy img-responsive" data-original="plugins/Speedtest/png/speedtest-bandwidth-month.png" style="border: 0" /><img src="plugins/Speedtest/png/speedtest-bandwidth-month.png" width="450" height="250"></a>
                    </div>
                    <div class="col-md-3">
                        <a onmouseover="return overlib('<div class=\'overlib-contents\'><img src=\'plugins/Speedtest/png/speedtest-bandwidth-year.png\' style=\'border:0;\' /></div>',FGCOLOR,'#ffffff', BGCOLOR, '#e5e5e5', BORDER, 5, CELLPAD, 4, CAPCOLOR, '#555555', TEXTCOLOR, '#3e3e3e',WRAP,HAUTO,VAUTO); " onmouseout="return nd();"><img class="lazy img-responsive" data-original="plugins/Speedtest/png/speedtest-bandwidth-year.png" style="border: 0" /><img src="plugins/Speedtest/png/speedtest-bandwidth-year.png" width="450" height="250"></a>
                    </div>
                </div>
            </div>
            <div class="panel panel-default">
                <div class="panel-heading">
                    <h3 class="panel-title">Latency during Speedtest</h3>
                </div>
                <div class="panel-body">
                    <div class="col-md-3">
                        <a onmouseover="return overlib('<div class=\'overlib-contents\'><img src=\'plugins/Speedtest/png/speedtest-latency-day.png\' style=\'border:0;\' /></div>',FGCOLOR,'#ffffff', BGCOLOR, '#e5e5e5', BORDER, 5, CELLPAD, 4, CAPCOLOR, '#555555', TEXTCOLOR, '#3e3e3e',WRAP,HAUTO,VAUTO); " onmouseout="return nd();"><img class="lazy img-responsive" data-original="plugins/Speedtest/png/speedtest-latency-day.png" style="border: 0" /><img src="plugins/Speedtest/png/speedtest-latency-day.png" width="450" height="250"></a>
                    </div>
                    <div class="col-md-3">
                        <a onmouseover="return overlib('<div class=\'overlib-contents\'><img src=\'plugins/Speedtest/png/speedtest-latency-week.png\' style=\'border:0;\' /></div>',FGCOLOR,'#ffffff', BGCOLOR, '#e5e5e5', BORDER, 5, CELLPAD, 4, CAPCOLOR, '#555555', TEXTCOLOR, '#3e3e3e',WRAP,HAUTO,VAUTO); " onmouseout="return nd();"><img class="lazy img-responsive" data-original="plugins/Speedtest/png/speedtest-latency-week.png" style="border: 0" /><img src="plugins/Speedtest/png/speedtest-latency-week.png" width="450" height="250"></a>
                    </div>
                    <div class="col-md-3">
                        <a onmouseover="return overlib('<div class=\'overlib-contents\'><img src=\'plugins/Speedtest/png/speedtest-latency-month.png\' style=\'border:0;\' /></div>',FGCOLOR,'#ffffff', BGCOLOR, '#e5e5e5', BORDER, 5, CELLPAD, 4, CAPCOLOR, '#555555', TEXTCOLOR, '#3e3e3e',WRAP,HAUTO,VAUTO); " onmouseout="return nd();"><img class="lazy img-responsive" data-original="plugins/Speedtest/png/speedtest-latency-month.png" style="border: 0" /><img src="plugins/Speedtest/png/speedtest-latency-month.png" width="450" height="250"></a>
                    </div>
                    <div class="col-md-3">
                        <a onmouseover="return overlib('<div class=\'overlib-contents\'><img src=\'plugins/Speedtest/png/speedtest-latency-year.png\' style=\'border:0;\' /></div>',FGCOLOR,'#ffffff', BGCOLOR, '#e5e5e5', BORDER, 5, CELLPAD, 4, CAPCOLOR, '#555555', TEXTCOLOR, '#3e3e3e',WRAP,HAUTO,VAUTO); " onmouseout="return nd();"><img class="lazy img-responsive" data-original="plugins/Speedtest/png/speedtest-latency-year.png" style="border: 0" /><img src="plugins/Speedtest/png/speedtest-latency-year.png" width="450" height="250"></a>
                    </div>
                </div>

Hopefully this helps someone having the same issues I did.

Cheers

Issue is that the images are using a older type of “lazy loading”.
See my comment for a full file :slight_smile: