Graph spikes in Cisco Nexus 5672UP

Hello,

I’m newbie on librenms and I have a new installation with some devices configured. My problem is that some of them show spikes of Tb on their overall traffic graphs and this values aren’t correct. Specifically, this occurs with devices Cisco Nexus 5672UP, Cisco NX-OS and a large amount of ports enabled. This is a graph of one of them:

The other devices show their graphs correctly without spikes.

This is validate.php output:

====================================
Component | Version
--------- | -------
LibreNMS  | 21.10.0-103-g905918f2e
DB Schema | 2021_25_01_0129_isis_adjacencies_nullable (224)
PHP       | 7.4.25
Python    | 3.9.2
MySQL     | 10.5.12-MariaDB-0+deb11u1
RRDTool   | 1.7.2
SNMP      | NET-SNMP 5.9
====================================

[OK]    Composer Version: 2.1.11
[OK]    Dependencies up-to-date.
[OK]    Database connection successful
[OK]    Database schema correct

I have checked out this link RRDTune - LibreNMS Docs and tested all the options but haven’t solved the issue. I have checked devices port settings too and the interfaces speed are ok.

Any idea of what may be happening or anything else I should check?

Thank you in advance.

Regards.

In my experience this is caused by incomplete SNMP polling where a polling session partially fails (device stops responding to the SNMP query part way through returning data) and this results in partial data being written to the database that includes traffic interface counter values of 0 instead of the correct running total.

On the subsequent polling session when correct traffic counters are received there is a huge “spike” in recorded traffic equal to the current traffic counter value minus the previous zero value.

This also causes port traffic utilisation alert rules to trigger if you have any set up. I discussed this problem over in this thread where I was getting bogus port utilisation alerts and the workarounds I found for this:

Personally I think this is a bug / design flaw in LibreNMS, as if an SNMP session fails (hangs) part way through it should be treated as a failed polling session (with all data discarded) rather than writing partial and incorrect data (including zero’s for port traffic counters) into the database.

We have a couple of models of switch which occasionally stop responding to SNMP queries part way through and while I can work around it with my alert rules I can’t do anything about the incorrect spikes in traffic graphs.

Is it possible the management interfaces of these switches are becoming overloaded at these times and are having difficulty responding to SNMP queries ? What are the poller statistics for one of these switches - does it have a long polling time and does it show any failed polling sessions ?

Hello @DBMandrake,

Thanks for you reply, it has helped me to look for more possible causes.

I have been reading your post and in my case the pollings seem to finish ok. Today I have seen more spikes (01:20h and 13:15h), but seems the polling was finished ok:

/opt/librenms/poller.php 66 2021-11-16 01:11:13 - 1 devices polled in 71.30 secs
/opt/librenms/poller.php 66 2021-11-16 01:16:12 - 1 devices polled in 70.80 secs
/opt/librenms/poller.php 66 2021-11-16 01:22:33 - 1 devices polled in 151.6 secs
/opt/librenms/discovery.php 66 2021-11-16 01:23:35 - 1 devices discovered in 368.6 secs
/opt/librenms/poller.php 66 2021-11-16 01:26:15 - 1 devices polled in 73.53 secs
/opt/librenms/poller.php 66 2021-11-16 01:31:13 - 1 devices polled in 71.16 secs

/opt/librenms/poller.php 66 2021-11-16 13:06:13 - 1 devices polled in 71.82 secs
/opt/librenms/poller.php 66 2021-11-16 13:11:26 - 1 devices polled in 84.38 secs
/opt/librenms/poller.php 66 2021-11-16 13:16:29 - 1 devices polled in 87.48 secs
/opt/librenms/discovery.php 66 2021-11-16 13:16:36 - 1 devices discovered in 420.5 secs
/opt/librenms/poller.php 66 2021-11-16 13:21:15 - 1 devices polled in 73.40 secs
/opt/librenms/poller.php 66 2021-11-16 13:26:14 - 1 devices polled in 71.85 secs

My doubt is about the discovery, it tooked more than 300 seconds in both cases (pollings are done every 300 seconds) and I don’t know if this can affect. I think it doesn’t because there is another discovery which took 374 seconds and there aren’t spikes at that time.

How can I check if there any failed polling sessions in the GUI?

About management interfaces, in my case, they haven’t overloads. The values ​​are within the correct parameters and the graphs of these interfaces don’t show incorrect stats.

Regards.

Ok I think I am seeing the same problems as you recently. In the last few days and last night in particular I’ve been seeing some crazy, random high traffic spikes that are triggering traffic alerts across many different switches.

Here are some examples from the wave of alerts I got last night, each one from a different switch of different models in a different part of the network :

High utilisation ports:

#1: Port: Slot0/1
Port Description: Ethernet Interface
Link Rate: 100 Mbit/s
Receive Rate: 108.85 Mbit/s
Transmit Rate: 5,080.27 Mbit/s
High utilisation ports:

#1: Port: eth0
Link Rate: 1,000 Mbit/s
Receive Rate: 0.00 Mbit/s
Transmit Rate: 48,834.04 Mbit/s
High utilisation ports:

#1: Port: 1/1
Port Description: D-Link DGS-3120-48PC R4.00.015 Port 1 on Unit 1
Link Rate: 1,000 Mbit/s
Receive Rate: 1,188.71 Mbit/s
Transmit Rate: 11,465.23 Mbit/s

#2: Port: 1/2
Port Description: D-Link DGS-3120-48PC R4.00.015 Port 2 on Unit 1
Link Rate: 1,000 Mbit/s
Receive Rate: 0.00 Mbit/s
Transmit Rate: 5,447.93 Mbit/s
High utilisation ports:

#1: Port: Slot0/2
Port Description: Ethernet Interface
Link Rate: 100 Mbit/s
Receive Rate: 0.00 Mbit/s
Transmit Rate: 2,346.08 Mbit/s
#1: Port: Slot0/1
Port Description: Ethernet Interface
Link Rate: 100 Mbit/s
Receive Rate: 0.00 Mbit/s
Transmit Rate: 3,483.05 Mbit/s

#2: Port: Slot0/2
Port Description: Ethernet Interface
Link Rate: 1,000 Mbit/s
Receive Rate: 33.96 Mbit/s
Transmit Rate: 6,297.74 Mbit/s
High utilisation ports:

#1: Port: Slot0/2
Port Description: Ethernet Interface
Link Rate: 1,000 Mbit/s
Receive Rate: 22,304.03 Mbit/s
Transmit Rate: 1,874,836.54 Mbit/s
#1: Port: eth1/0/1
Port Description: D-Link Corporation DGS-1250-28XMP HW A1 firmware 2.02.030
Port 1
Link Rate: 1,000 Mbit/s
Receive Rate: 256.65 Mbit/s
Transmit Rate: 3,702.75 Mbit/s

#2: Port: eth1/0/2
Port Description: D-Link Corporation DGS-1250-28XMP HW A1 firmware 2.02.030
Port 2
Link Rate: 1,000 Mbit/s
Receive Rate: 0.00 Mbit/s
Transmit Rate: 5,304.65 Mbit/s
#1: Port: 1/1
Port Description: Ethernet Interface
Link Rate: 1,000 Mbit/s
Receive Rate: 100.11 Mbit/s
Transmit Rate: 1,511.30 Mbit/s

#2: Port: 1/2
Port Description: Ethernet Interface
Link Rate: 1,000 Mbit/s
Receive Rate: 0.00 Mbit/s
Transmit Rate: 966.40 Mbit/s
#1: Port: GigabitEthernet1
Link Rate: 100 Mbit/s
Receive Rate: 38,199.96 Mbit/s
Transmit Rate: 1,672.78 Mbit/s

#2: Port: GigabitEthernet2
Link Rate: 100 Mbit/s
Receive Rate: 37,463.11 Mbit/s
Transmit Rate: 1,295.55 Mbit/s
#1: Port: 1/2
Port Description: D-Link DGS-3120-48PC R4.00.015 Port 2 on Unit 1
Link Rate: 100 Mbit/s
Receive Rate: 0.00 Mbit/s
Transmit Rate: 4,192.39 Mbit/s
#1: Port: Slot0/1
Port Description: Ethernet Interface
Link Rate: 1,000 Mbit/s
Receive Rate: 178.03 Mbit/s
Transmit Rate: 2,077.18 Mbit/s

#2: Port: Slot0/2
Port Description: Ethernet Interface
Link Rate: 1,000 Mbit/s
Receive Rate: 0.00 Mbit/s
Transmit Rate: 4,759.95 Mbit/s
#1: Port: Slot0/1
Port Description: Ethernet Interface
Link Rate: 1,000 Mbit/s
Receive Rate: 2.45 Mbit/s
Transmit Rate: 3,355.53 Mbit/s

#2: Port: Slot0/2
Port Description: Ethernet Interface
Link Rate: 1,000 Mbit/s
Receive Rate: 0.00 Mbit/s
Transmit Rate: 2,988.57 Mbit/s

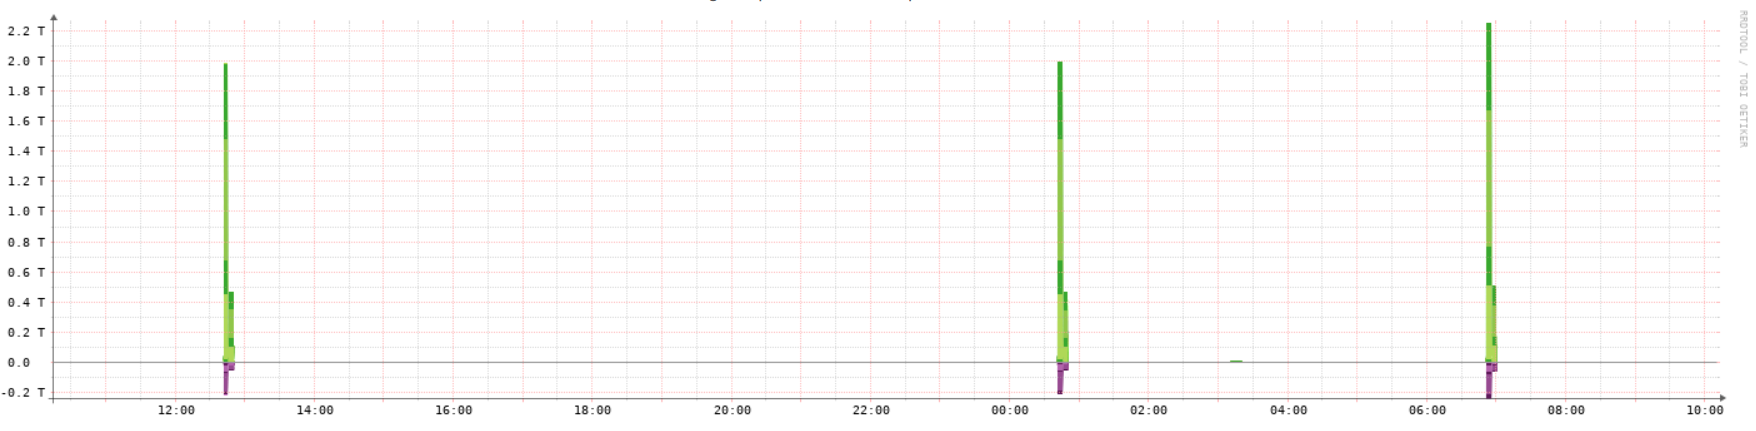
On the traffic graphs I see spikes at this time going as high as 7Gbps on devices that only have 1Gbps ports… so something really whacky is going on here.

I’m also intermittently seeing sensor devices like temperature sensors turning returning 0 values - setting off low temperature alerts, for example:

Alerting sensors:

Sensor #1: edge
Temperature: 0 °C
Low Temperature Limit: 20 °C

Sensor #2: temp1
Temperature: 0 °C
Low Temperature Limit: 20.875 °C

And also voltage alerts:

Alerting sensors:

Sensor #1: vddgfx
Sensor class: voltage
Current value: 0
Low Limit: 0.74885

This one above is interesting as it’s the ubuntu server that runs LibreNMS! So it’s polling itself over loopback and yet still returning bogus temperature values for both advertised temperature sensors.

Here’s voltage sensors on another linux based server reporting 0 voltage:

Alerting sensors:

Sensor #1: vddgfx
Sensor class: voltage
Current value: 0
Low Limit: 0.74885

Sensor #2: vddnb
Sensor class: voltage
Current value: 0
Low Limit: 0.87635

I wonder if there have been any updates in the last few weeks affecting SNMP polling ? Looking back in my alert logs I seem to have been getting intermittent bogus 0 values for sensors since around the 20th of October, although it seems to have got a lot worse in the last week.

Anyone have any idea why SNMP polling keeps returning bogus 0 values ? While I haven’t checked I’m fairly sure that bogus 0 values for interface traffic counters is what is causing the spikes on the traffic graphs as well.

Is it possible to check specific polled historical data with an SQL query to see what values were being returned when the alerts happened, or is the data just fed into rrdtool to store in it’s own database, and thus resolution is lost over time ?

Edit: I should probably add that most of these alerts occurred soon after 12:17am last night, which would have been soon after an automatic update.

I’ve just noticed that you’re using a daily (development) build here but it’s quite an old one as 21.10.0 is quite old - do you not have the daily.sh script running in cron to update ?

I’ve just realised that for the whole year and a half I’ve been running LibreNMS I’ve been on the developer nightly branch (master) because I thought that’s what everyone ran and I didn’t realise there was a monthly branch available - how unobservant am I. :slight_smile: (or is the monthly branch new in the last year ?)

Despite this there have only been a small handful of cases in that time where an update has caused me an issue and it has always been quickly resolved, which just goes to show how stable even the development version of the code is. However now that I’m aware there is a monthly release channel I’ve switched to it using these instructions. I don’t need bleeding edge functionality and a monthly update is still pretty regular.

So I was previously on 21.11.0-18-g7893b8beb which I think is from yesterday, I’m now on the 21.11.0 monthly release which was released on the 12th, so slightly older.

I’ll see how things go on the monthly release channel.

Yes, I have configured the development branch because I wanted to check if some of daily updates would solve the problem with the spikes… But so far i have no luck :smiley:

The cron is working every day, I check it in server logs and in the “About LibreNMS” section.
The version you say was from last week, but today I have this one:

====================================
Component | Version
--------- | -------
LibreNMS  | 21.11.0-20-gf12d1f98c
DB Schema | 2021_11_12_123037_change_cpwVcID_to_unsignedInteger (225)
PHP       | 7.4.25
Python    | 3.9.2
MySQL     | 10.5.12-MariaDB-0+deb11u1
RRDTool   | 1.7.2
SNMP      | 5.9
====================================

[OK]    Composer Version: 2.1.12
[OK]    Dependencies up-to-date.
[OK]    Database connection successful
[OK]    Database schema correct

For the moment I will keep the configuration like this, but in the future I’m going to change to the release branch :slight_smile:

Ah OK.

You picked an inopportune time to switch to the nightly builds though, looking at some discussion in other threads, the git commit history and my last few days graphs there was a poller change made a few days ago that broke collection of traffic from some (but not all!) of our switches which I think has now been reverted/fixed, so this unrelated problem would have confused the issue you were already seeing.

I think this is what caused my sudden spate of traffic spikes and alerts earlier in this thread. For now I’m going to stay with the monthly stable builds and see how my system runs - no alerts or weird spikes since then that I’ve noticed.

Thanks for the info. I also saw one day that several devices stopped creating their graphs suddenly. I have to delete and create it again, with this we solved the issue.

Anyway, I have changed to the release branch too, we’ll see if there are any changes in the graphs.

This topic was automatically closed 90 days after the last reply. New replies are no longer allowed.