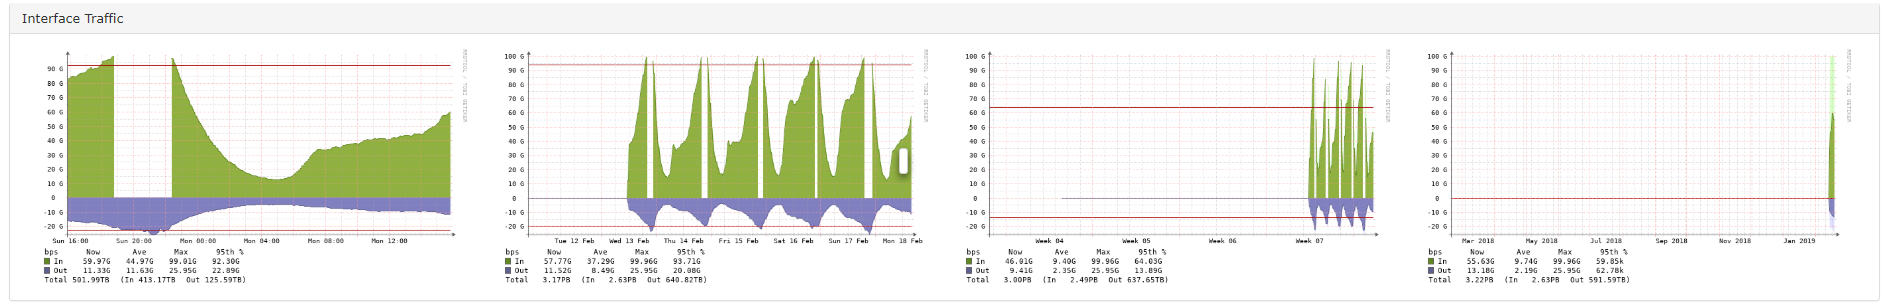
When the traffic on a 200G LAG reaches above 100G the graph is zeroed out. Is this a 32bit counter problem or something like that?
Using Chrome: 72.0.3626.96 (Official version) (64 bitar)
LibreNMS info:
Chas
18 February 2019 15:59
2
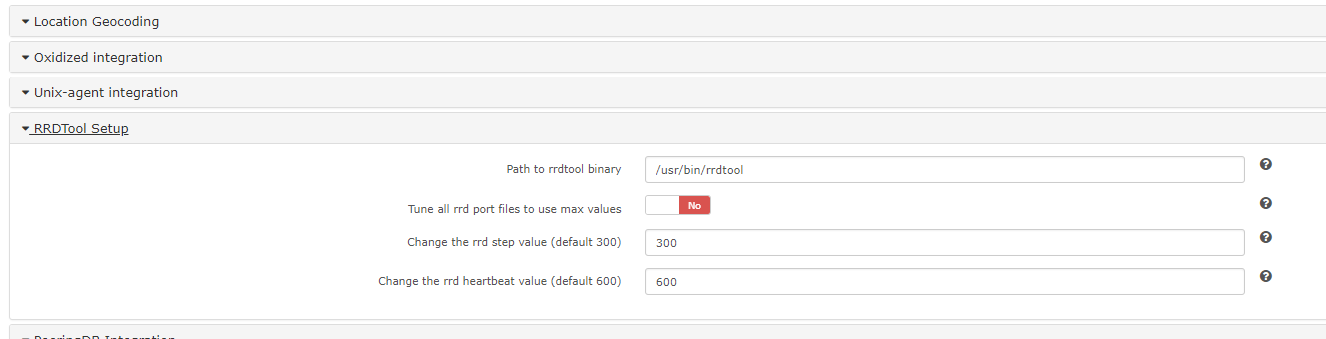
Thanks for the answer, but we don’t use that value under rrd tool settings. I checked both global, under device and under the ports.
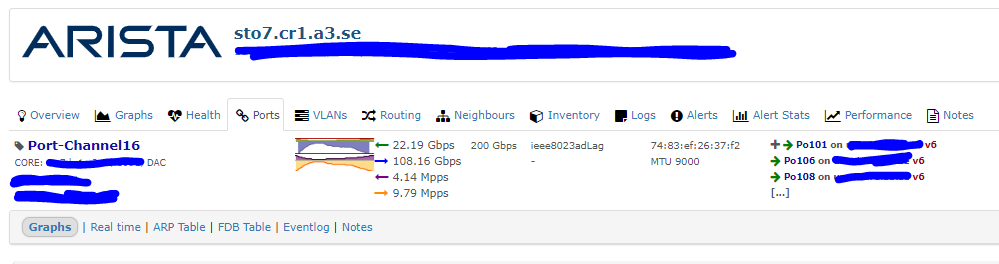
LibreNMS reports the LAG as 200G. So it seems to get the correct values from SNMP.
Chas
18 February 2019 20:37
5
According to the doc, the default RRD max is 100G.
Your ifSpeed is already 200G, then all you need to do is run the tune_port.php script for that device which alters the RRD file to max of 200G (ifSpeed) and you should start graphing.
Chas:
According to the doc, the default RRD max is 100G.
Your ifSpeed is already 200G, then all you need to do is run the tune_port.php script for that device which alters the RRD file to max of 200G (ifSpeed) and you should start graphing.
Hmm, maybe the default needs to be increased…
2 Likes
Just to followup, tune_port.php all worked. Now all is well with the graphs.
I have the saem issue, i have aply de fix, but this is not working for trunk, only for single ports.
1 Like
You need to run tune port manually on the trunk rrd if you can’t get the script to do it for you.