New librenms python poller service is underperforming badly for some devices

Just to confirm, it looks like performance of this new poller service degrades over time, polling times are getting slower and slower:

The old one exhibits consistently good performance.

Possibly the new service handles devices that exceed configured polling period in a different way (some stale or incomplete threads/ jobs keep accumulating slowing everything down?)

I think murrant meant changing to 300 seconds for poller frequency fix it?

No I meant using the old service. Switching to 300s for poller sounds like a pain. Although it would be interesting to know if it has any effect.

Just to let you know, I have just tried the new librenms.service again (was using legacy one due to these problems) with the latest and greatest version 1.52, but unfortunately the issue still persists:

image

However, it looks like the only devices affected by this at the moment are Nexus 5K, the polling graphs for other stuff look fine - have you got any idea what could it be?

More detailed polling graph from affected 5K:

Are you using this? https://docs.librenms.org/Extensions/Dispatcher-Service/

Correct, this is the guy I have problem with (librenms-service.py)

The old service (poller-service.py) however works fine on the same box with the same setup

It really looks like only Nexus 5K devices are affected by this problem with new service at the moment - but the impact is rather dramatic. The only ‘special’ think about them I can think of is that they have got a lot of ports (more than our other network kit, generally), but it does not make sense still…

Considering they all just call poller.php the poller process should take the same time for all.

Are you using selective port polling?

Adding just another image of poller performance sample across the board:

I had to remove hostnames, as they are rather sensitive, but marked Nexus 5Ks where applicable.

This new librenms-service.py service was active from around 12:00 to 16:00 - I reverted to old service at that point.

It looks like new service generally perform a bit better than old one across the board, except for these Nexus 5K devices (we have got 4 in total), where polling is simply catastrophically broken for some reason…

No We have a totally new service are you are talking about… from back in 2018?

See here https://docs.librenms.org/Extensions/Dispatcher-Service/

Yes, this is the new guy I am using and have problem with - librenms-service.py AKA Dispatcher Service. Not using selective interface polling.

I had a quick look and compared commands triggered by these services, the new one seems to be stuck in Nexus case here:

/usr/bin/snmpbulkwalk -Cr30 -v2c -c -OQUs -m IF-MIB -M /opt/librenms/mibs:/opt/librenms/mibs/cisco -t 10 udp:nexus-hostname:161 ifXEntry

What is worse, it seems to be spawning more and more of these ifXEntry guys over time, even when one does not finish in time.

systemctl status librenms.service | grep nexus-hostname

       ├─12212 /usr/bin/snmpbulkwalk -Cr30 -v2c -c          -OQUs -m IF-MIB -M /opt/librenms/mibs:/opt/librenms/mibs/cisco -t 10 udp:nexus-hostname:161 ifXEntry
       ├─20021 /usr/bin/snmpbulkwalk -Cr30 -v2c -c          -OQUs -m IF-MIB -M /opt/librenms/mibs:/opt/librenms/mibs/cisco -t 10 udp:nexus-hostname:161 ifXEntry

The old service also seem to spend a lot of time in ifXEntry, but in this case the process actually finishes within 30 seconds or so (or maybe old service script just kills it if it takes too long??)

systemctl status librenms-poller-service.service | grep nexus-hostname

       ├─12665 /usr/bin/snmpbulkwalk -Cr30 -v2c -c          -OQUs -m IF-MIB -M /opt/librenms/mibs:/opt/librenms/mibs/cisco -t 10 udp:nexus-hostname:161 ifXEntry

BTW: this is all with 60 second polling

Just wondering if you got any idea here guys?

At least it looks like new librenms.service should be improved so it does not spawn multiple snmpwalk processes for the same thing (if the previous one is still running and processing), DoSing the device as a result. It looks like old service was not doing this.

Sadly due to this Nexus issue I had to give up on this thing (again) and rolled back to the old librenms-poller-service :frowning:

The service does not spawn any snmpwalk processes. There is actually a timeout for the SNMP process, so they should not be running forever.

Can you show your stats on the pollers page? Also, check the logs to see if polls are overlapping.

It sounds like your Nexus devices can’t handle 1minute polling. Somehow the old service compensates for that. Have you tried the cron jobs? Why don’t you want to use selected port polling?

Hey, thanks for the response.

Polling for these Nexus devices takes a bit more than 60 seconds (around 70 - 90, depending on the device), so the pollling never finishes within original timeframe (60 seconds), which I agree is not ideal - but also this has never been a problem with the old service and I am only seeing very occasional gaps in the graphs because of this, which is acceptable to me.

I would love to have a better solution for this (Nexus kit is in the same datacenter and librenms, so no latency issues) but this value is already after tuning max repeaters/OIDs parameters.

I looked into selective polling some time ago, but it looks like the devices in question won’t benefit from it:

(in fact, it seems to be even slower for some reason)

It does indeed look like the old service handles this case with overrunning polling better somehow, the new one seems to be gradually DoSing these devices by spawning more and more of these guys, as shown on the graphs. They will probably timeout eventually, but maybe not quickly enough.

I can keep using the old service, as it works, but the new one gives me a little bit better performance for other devices and I am also concerned that the old one will not be supported for much longer. Cronjobs work too, but they seem to be slower / less flexible than the service.

So, it takes 122 seconds to poll ports alone but you are doing 1 minute polling?

I really don’t understand how that is supposed to work. How do you think it should work?

There are only three outcomes I can think of in that situation.
A. Catastrophic run-away polling times.
B. Corrupted/incomplete polling
C. Many gaps

My guess Dispatcher Service is A, Old poller service is B.

1 Like

Running this particular script took 122 sec in this case, since there was also regular poller hammering device at the same time. With polling disabled for this device, the output looks more like this:

The thing is that I have got around 150 devices in LibreNMS and polling for >140 of them finishes way within 60 seconds (on average 10 or so).

Those few which overrun, mostly don’t even overrun consistently (depends on the load on the device, etc) - in many cases they can still be done with polling within a minute or so, but happen to periodically have some ‘bad polls’ taking over a minute.

Obviously, the ideal case would be to be able to consistently poll everything < 60 sec, but this is not really realistic, with so many different hardware types and device types involved. We still very much want to use one minute polling, as the default value is just too slow to rely on to monitor things like interfaces going down. We leverage heavily API and mysql queries against LibreNMS DB to monitor sanity of our entire network estate and knowing about core link dying or being hammered by traffic 5 minutes after the fact is not very impressive (people are usually shouting very loudly by then anyway…)

Also traffic stats averaged into 5 minutes buckets are not super useful for granular visibility either, especially with our rather busty network traffic patterns.

So the next ideal option would be to be able to selectively specify polling rate on the device level - we could then set polling to let’s say 2 minutes for those naughty devices which tend to overrun. As far as I am aware, this is currently not possible - please correct me if I am wrong though?

Taking the above into consideration, we simply let some device overrun and use this as ‘poor man’s per-device polling rate’ mechanism. I did not look into what specifically happens in such case (with old service, at least), but this seems to work fine.

Even for the very busy devices which happen to have frequent > 100 seconds poll time, we are not seeing a problem, for example this is graph for the last 2 hours from the most naughty Nexus device, it does not show any gaps:

Poller times for this specific guy are as follows:

As you can see there are no gaps in poller stats, even though the process is constantly overruning. We also get valid ports state, etc information from these overrunning devices. We do very rarely see the gaps on individual graphs, but this is not really a problem.

My assumption is that in the traditional poller/service there is some mechanism that would let the previous job to finish before starting new one, even if it takes longer than 60 seconds. This potentially works as a crude ‘dynamic poll interval’ implementation - it is not perfect, but RRD interpolation based on the step time seems to take care of filing in the gaps when the data arrives later or less frequently than expected in those corner cases. It will just to its best to keep graphs accurate as quickly as possible for that specific device.

So I would add another item to your list:

D. Just let polling run for as long as it needs to run (up to a certain threshold of course, like 4x of poll interval value or so) without interfering with it or spawning a new job at the same time - and let RRD tool to fill in the gaps. There will be some accuracy / precision loss in this case or even occasional gaps, but this is acaceptable since we are talking about only 5% or so devices affected by this - and the benefit of 60 second polling for the rest of the estate totally justifies this.

I hope this all makes sense, very sorry if somehow I come across as pushy or ‘assholistic’ about it - I am just very passionate about LibreNMS and really love this platform and want it to be even better than is now when it comes to polling :slight_smile:

Many people don’t need 1 minute polling that use it.

There is fast ping functionality that can ping every 30s or less.
There is support for traps so you can get port up/down alerts very quickly.

Perhaps with the above you could back off to 2 minute polling and have much more success or reduce the amount of things you are polling.

Just let polling run for as long as it needs to run (up to a certain threshold of course, like 4x of poll interval value or so) without interfering with it or spawning a new job at the same time - and let RRD tool to fill in the gaps. There will be some accuracy / precision loss in this case or even occasional gaps, but this is acaceptable since we are talking about only 5% or so devices affected by this - and the benefit of 60 second polling for the rest of the estate totally justifies this.

There is a lot you and I don’t understand here:

  1. Are the jobs overlapping? and in which service are they overlapping? (Neither will terminate the poll if it goes overtime) Both have locking to prevent double polling, but the locking in the old poller service is totally broken I think.
  2. RRD tool cannot fill in gaps by design. If you miss a heartbeat window, the data is null, you cannot enter historical data.
  3. I can’t really improve the situation you are describing (and I really do) until I understand why it is happening and I need your help here because I don’t think I can reproduce the issue.

RRD tool really ties I our hands on how we can handle polling that goes over the window. The reason you don’t get gaps on the old poller is even though the polling overlaps the same portion of the poll happens roughly every 5 minutes. Which is lucky. (I don’t like luck). I’m not sure how the the new dispatch service handles the overages because, again, it is very hard for me to reproduce.

Hey, thanks for the response. To address your questions:

  1. The jobs are NOT overlapping with the old service (librenms-poller-service.service). There will never be one than more instance poller.php (running ‘snmpbulkwalk’) process for a particular device when using it.

I did watch the behavior of the old service for the ‘problem device’ (consistently taking more than 60) seconds to poll, and it simply lets the polling finish whenever it finishes, then starts another job run - which basically makes it to be in perpetual polling state (which is OK), but with NO overlap at any point in time.

OLD SERVICE:

With the new service (librenms.service) jobs ARE overlapping. After 60 seconds (my global polling interval), another instance of the poller.php is spawned, ignoring the fact that one is still finishing the run:

NEW SERVICE going crazy and spawning parallel jobs:

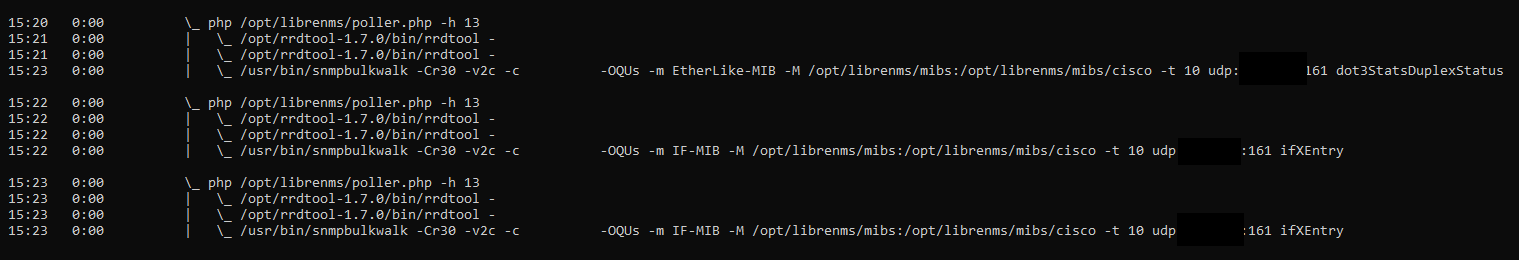
This eventually spirals out of control, as more and more concurrent jobs are spawned (I counted 9 of them at some point…), DoSsin the device as a result.

So definitively the core of the issues is that the new service has got some problem with locking (which is supposed to be preventing double polling?) - which is somehow is working and locking just fine when using old service.

  1. I must say I am very confused in terms of how RRD tool works exactly, it seem a bit arcane magic… Their docs do state however: “Note, that if you do NOT supply new data points exactly every 300 [60 in my case] seconds, this is not a problem, RRDtool will interpolate the data accordingly.” (whatever that means)

Regardless, I am constantly missing one or two poll intervals (60 seconds in my case) for some of the devices and not really getting any gaps in the graphs, as shown in my previous message - and there is definitively NO overlap. I think I am as equally puzzled about it as you :). All my RRDs are configured with 60 seconds step.

  1. It definitively look like spawning of overlapping jobs by the NEW service is the root cause here - would it be possible implement more strict locking there, akin to the one done by old service?

This is the relevant quote for skipping data. I believe heartbeat is 2x step in LibreNMS.

The next parameter is heartbeat . In our example, heartbeat is 600 seconds. If the database does not get a new PDP within 300 seconds, it will wait for another 300 seconds (total 600 seconds). If it doesn’t receive any PDP within 600 seconds, it will save an UNKNOWN value into the database. This UNKNOWN value is a special feature of RRDtool - it is much better than to assume a missing value was 0 (zero) or any other number which might also be a valid data value. For example, the traffic flow counter on a router keeps increasing. Lets say, a value is missed for an interval and 0 is stored instead of UNKNOWN. Now when the next value becomes available, it will calculate the difference between the current value and the previous value (0) which is not correct. So, inserting the value UNKNOWN makes much more sense here.

Yes, I did notice a problem with locking for the new dispatcher service. It sets a timeout of the poller period, so the lock releases after 60s in your case. Not sure why multiple would start after that though.

You could try setting timeout to 120 in quemanager.py:385 and see if that helps. But we can’t do that upstream because it can cause an issue if the lock is not released by a poller for some reason (crashing etc).

Thank you, the heartbeat set to 600 by default possibly explains why I am not getting the gaps even after in situations when I am missing a few 60 seconds polls?

I did monkey patch this you suggested value and set it to the worst case scenario for my setup (250 seconds) - this seems to work well, I am not getting duplicate poller.php jobs any more. New poller looks as healthy as the old one now :slight_smile:

Still, it feels like it would make sense to not rely on timeout alone, but actually do some check if the process is still running, before spawning another poller.php for the same device - and potentially forcefully killing these guys if they really keep overrunning (5 minutes or so) or there is no hope for them to finish in any sensible time, otherwise duplicates will just keep accumulating, like in my case (I counted 9 at some point).