The RRD’s of the Raspberry PI Frequencies aren’t filled with data.
Verbose, debug, discovery; https://p.libren.ms/view/d5631f09 https://p.libren.ms/view/a340ba3f
Component
Version
LibreNMS
1.32-50-g89ff05e
DB Schema
211
PHP
7.0.22-0ubuntu0.16.04.1
MySQL
5.7.19-0ubuntu0.16.04.1-log
RRDTool
1.5.5
SNMP
NET-SNMP 5.7.3
[OK]
Database connection successful
[OK]
Database schema correct
Kevin_Krumm:
./poller.php -r -f -h HOSTNAME -d
https://p.libren.ms/view/c5323f0c
Checked the link and found the same issue in the image shown in this reply;
So…
[image]
@laf I’ve been trying to wrap my head around what is going wrong. I’ve been looking at the discovery logs some of the other users have been posting, and I was seeing a difference in the array. In my array, all values are ISO:
[raspberry_pi_sensors] => Array
(
[3.6.1.4.1.8072.1.3.2.4.1.2.9.114.97.115.112.98.101.114.114.121.1] => Array
(
[iso] => 48.3
)
and I’ve seen others with nsExtendOutLine."raspberry" and…
After that I didn’t found the solution to it.
hmm @murrant @laf
It seem you are missing the basic snmp mibs.
This should fix it:
sudo apt-get install snmp-mibs-downloader
sudo download-mibs
1 Like
snmp-mibs-downloader is already the newest version (1.1).
I do get information from snmp,
snmpwalk -v2c -c community pi1 iso.3.6.1.4.1.8072.1.3.2.3.1.2.9.114.97.115.112.98.101.114.114.121
The problem is that the information is not saved to the corresponding RRD files (sensor-frequency-raspberry_freq-6.rrd and sensor-frequency-raspberry_freq-7.rrd).Untitled - LibreNMS
I’ve already tried to remove the sensor RRD files and the corresponding entries in the database, rediscovered the sensors but this still didn’t do the trick.
Jo0Lz
23 October 2017 08:23
10
This is a seperate issue to the device not being polled correctly. The data is being shown, but the graphs aren’t being created (correctly).
I just found I have the same issue on both my PI’s, the data shows in the overview, but unlike the graphs for the other sensors, the graphs of the frequency is empty on both devices.
Thanks @Jo0Lz
Can one of you go to the graph, click on it, then click Show Command and paste the output here.
Jo0Lz
24 October 2017 08:03
13
Sure thing.
RRDTool Command:rrdtool graph /tmp/kzvvIzWUSTjsl608 -l 0 -E --start 1508745600 --end 1508832000 --width 1728 --height 487 -c BACK#EEEEEE00 -c SHADEA#EEEEEE00 -c SHADEB#EEEEEE00 -c FONT#000000 -c CANVAS#FFFFFF00 -c GRID#a5a5a5 -c MGRID#FF9999 -c FRAME#5e5e5e -c ARROW#5e5e5e -R normal --font LEGEND:8:DejaVuSansMono --font AXIS:7:DejaVuSansMono --font-render-mode normal COMMENT:' Last Max\n' DEF:sensor=/opt/librenms/rrd/domotica.jo0lz.nl/sensor-frequency-raspberry_freq-6.rrd:sensor:AVERAGE LINE1.5:sensor#cc0000:'ARM ' GPRINT:sensor:LAST:%3.0lfHz GPRINT:sensor:MAX:%3.0lfHz\l HRULE:1260000000#999999::dashes HRULE:500000000#999999::dashes
RRDTool Output:1809x556OK u:0.08 s:0.00 r:0.08
@murrant , do you have any update on this issue?
Jo0Lz
15 November 2017 09:59
15
The RRD tool output is there, maybe this will help:
graph /tmp/hnmAftlmW8A0XJRP -l 0 -E --start 1510653000 --end 1510739400 --width 862.2 --height 312.33333333333 -c BACK#EEEEEE00 -c SHADEA#EEEEEE00 -c SHADEB#EEEEEE00 -c FONT#000000 -c CANVAS#FFFFFF00 -c GRID#a5a5a5 -c MGRID#FF9999 -c FRAME#5e5e5e -c ARROW#5e5e5e -R normal --font LEGEND:8:DejaVuSansMono --font AXIS:7:DejaVuSansMono --font-render-mode normal COMMENT:' Last Max\n' DEF:sensor=domotica.jo0lz.nl/sensor-frequency-raspberry_freq-6.rrd:sensor:AVERAGE LINE1.5:sensor#cc0000:'ARM ' GPRINT:sensor:LAST:%3.0lfHz GPRINT:sensor:MAX:%3.0lfHz\l HRULE:1260000000#999999::dashes HRULE:500000000#999999::dashes --daemon 127.0.0.1:42217

command returned (943x381 OK u:0.04 s:0.00 r:0.04 )

-rw-rw-r-- 1 www-data www-data 12814 Nov 15 10:56 /tmp/hnmAftlmW8A0XJRP graph
Runtime 0.062s
SNMP 0.00s: Get[0/0.00s] Getnext [0/0.00s] Walk [0/0.00s] MySQL 0.01s: Cell[1/0.00s] Row[0/-0.00s] Rows[3/0.00s] Column[1/0.00s] Update[1/0.01s] Insert[0/0.00s] Delete[1/0.00s] RRD 0.00s: Update [0/0.00s] Create [0/0.00s] Other [0/0.00s]
It’s the image URL with &debug=true added. I’ve been trying to see what is up with this, but haven’t gotten anywhere. The file sensor-frequency-raspberry_freq-6.rrd is there.
RRD[[0;32mupdate pi1.homeserv.lan/sensor-frequency-raspberry_freq-6.rrd N:1200000000 --daemon
1200000000 > 20000, the max value set to be allow to be stored in that rrd.
Try applying this patch and deleting the two frequency rrds :
diff --git a/includes/polling/functions.inc.php b/includes/polling/functions.inc.php
index 055a07fac..b7c0babaa 100644
--- a/includes/polling/functions.inc.php
+++ b/includes/polling/functions.inc.php
@@ -166,7 +166,7 @@ function record_sensor_data($device, $all_sensors)
         }

         $rrd_name = get_sensor_rrd_name($device, $sensor);
-        $rrd_def = RrdDefinition::make()->addDataset('sensor', 'GAUGE', -20000, 20000);
+        $rrd_def = RrdDefinition::make()->addDataset('sensor', 'GAUGE');

         echo "$sensor_value $unit\n";
1 Like
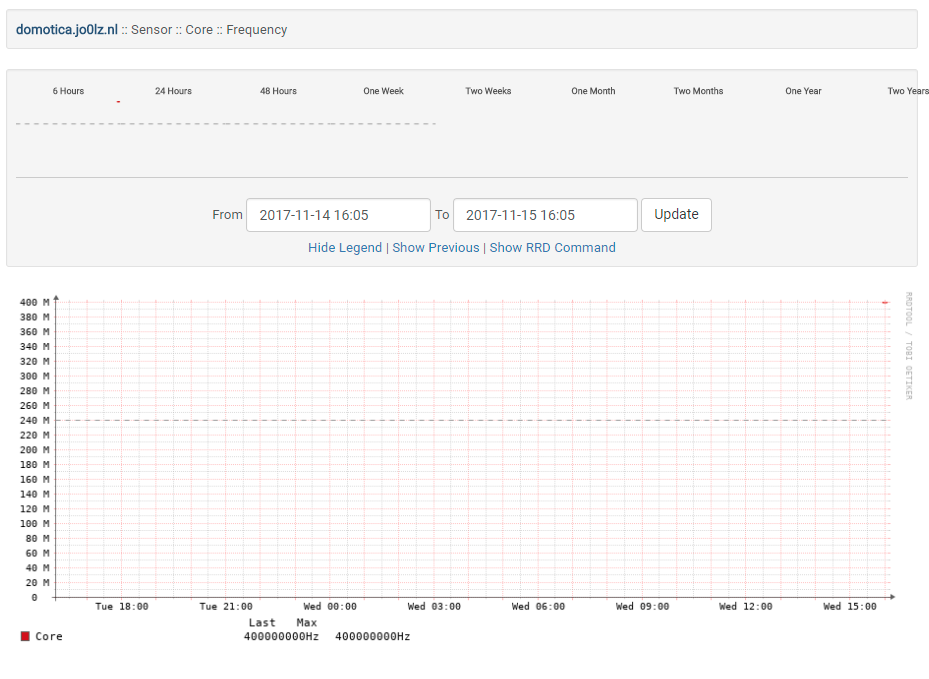
Jo0Lz
15 November 2017 15:07
17
Nice!
Both graphs are created now. Thanks!
You can remove the changes, it will keep working since the rrd is already created. We’ll probably merge a fix upstream.
Jo0Lz
17 November 2017 12:54
19
Clear. Reverted the changes. Thanks for the help!
The fix isn’t in the latest code yet.
 yall have any idea on this?